Figure 5.
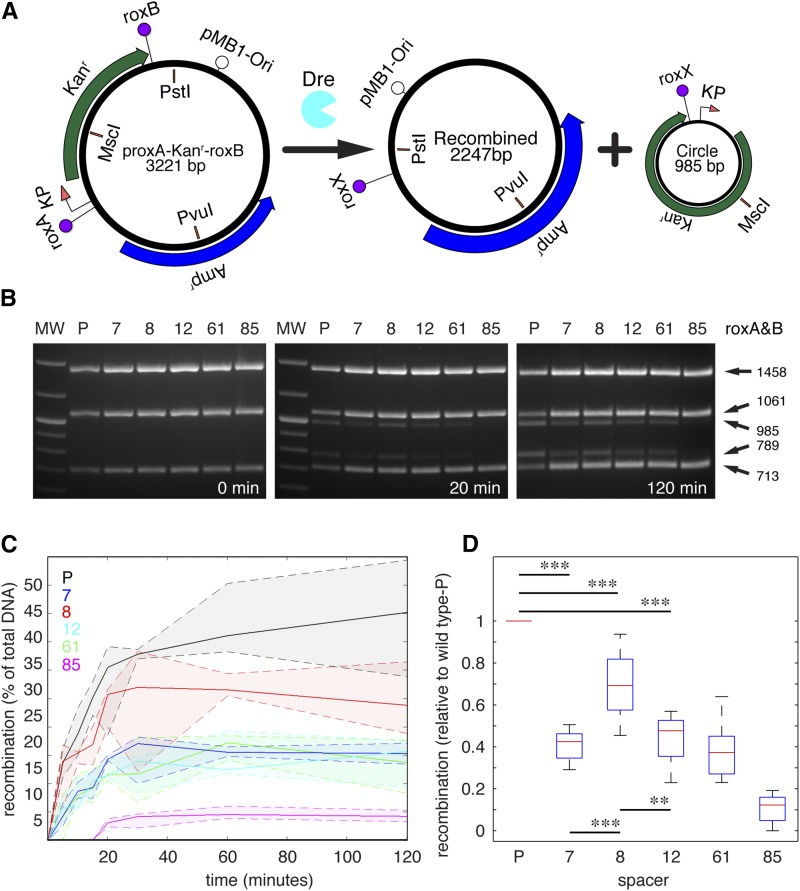
Self-recombination efficiencies of roxP and novel sites tested in purified system. (A) Diagram of in vitro recombination reaction. proxA-Kanr-roxB DNA is exposed to affinity-purified Dre, resulting in a recombined plasmid and a circle. Digestion with PvuI + PstI + MscI results in a common PstI-PvuI 1458 bp fragment spanning the pMB1 origin and part of the Ampr and two alternative, recombination-dependent sets of fragments. Without recombination, a MscI–PstI 713 bp fragment spanning the roxB site and a PvuI–MscI 1061 bp fragment spanning the roxA can be detected (see for instance the 0 min timepoint in B). After recombination, a PstI–PvuI fragment of 789 bp spanning the roxX site is observed in the remaining vector, and the 985 recombination circle is linearized by MscI. Without MscI digestion, the recombination circle migrates at about 600 bp (not shown). (B) Representative gels for the 0, 20, and 120 min time points reveal gradually accumulating recombination products. Lanes represent either marker (MW), or the prox-Kanr-rox vectors carrying either wild type (P) or spacers 7, 8, 12, 61, and 85 at both roxA and roxB sites (Figure 4A). Note that samples for the 20 and 120 min time points are taken from the same gel. (C) Densitometric analysis revealing percent recombination over the 120 min timecourse for wild type and all five mutant spacers. Solid lines represent medians, and dotted lines 25th and 75th quartiles for each set of samples (n = 6 data points/spacer and time point). (D) Box plots for the 60 min time point. Recombination efficiencies for each mutant spacer are shown as ratios to the wild type (P) from the same experiment (n = 10 data points/spacer). (Kolmogorov–Smirnov two sided test, significance levels ** P < 0.005, *** P < 0.001.)

