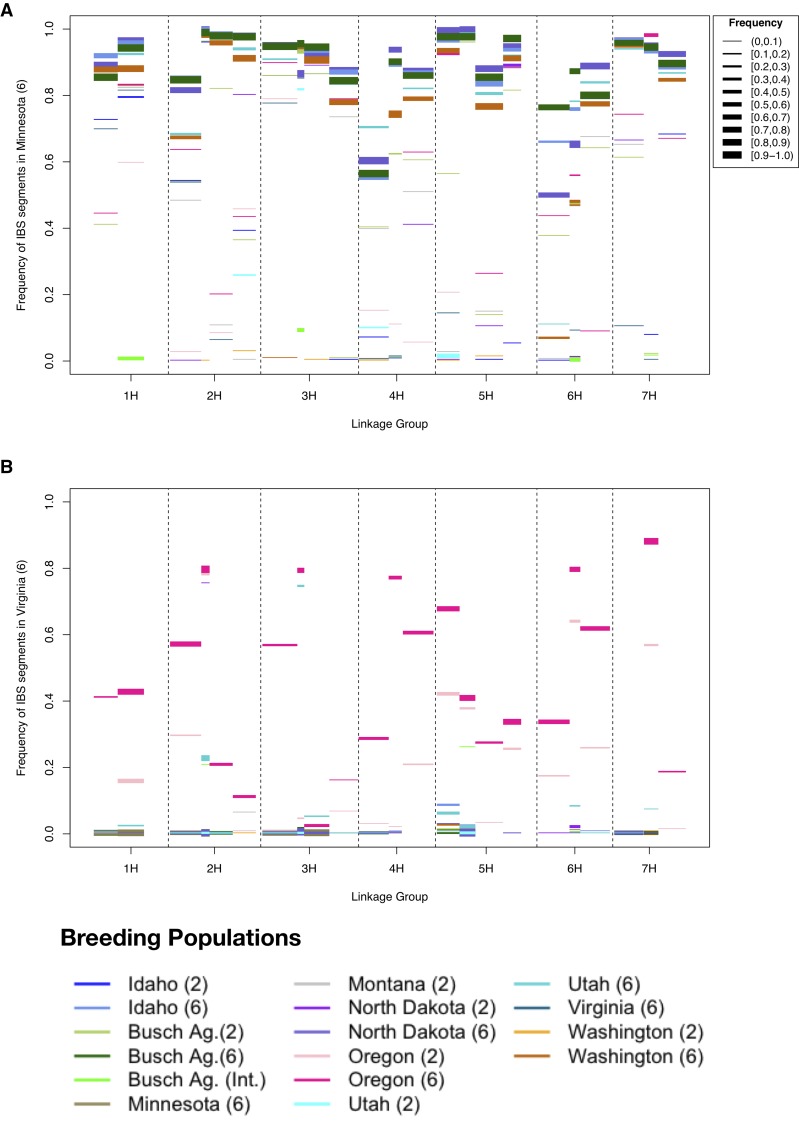
Figure 5.
Frequency of IBS haplotypes in breeding populations from (A) University of Minnesota and (B) Virginia Polytechnic Institute and State University. Using 100 SNP windows. Linkage groups are in the X-axis. The Y-axis is the frequency of the haplotype in the population indicated in the Y-axis label (“base population”). The color of the bars in the plot represents the distinct barley breeding populations that share the same segment with the “base population”. The width of each bar corresponds to the frequency of that haplotype in the compared populations. The depiction shows that there is a high frequency of shared haplotypes among six-rowed spring barleys. This contrasts with the Virginia population (winter six-rowed) which shares a few chromosome segments only with Oregon six-rowed and to a lesser extent Oregon two-rowed.

