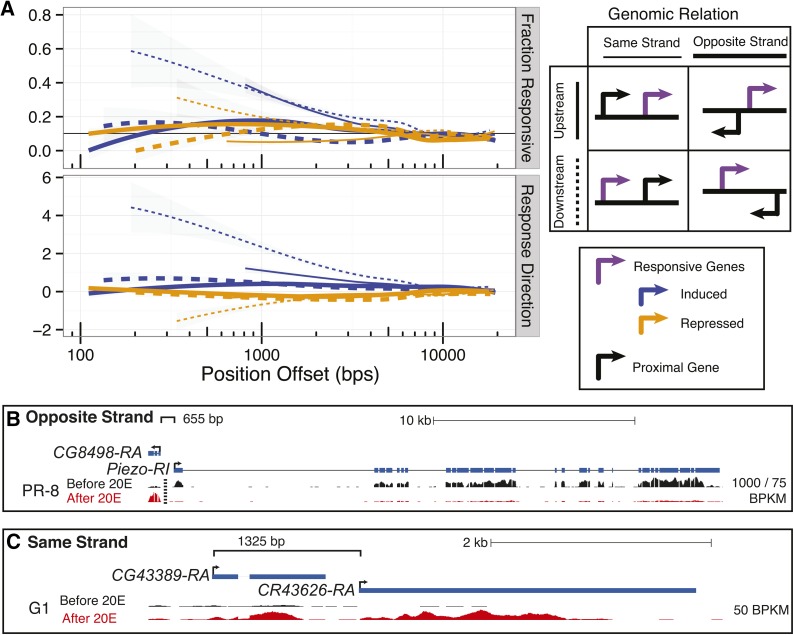
Figure 3.
Genomic positional dependence of ecdysone response. (A) Each line represents the smoothed fraction of either responsive genes (upper panel) or response direction (lower panel). Response direction is measured by the mean of the magnitude and direction of response for genes within a moving window across genomic position. Genes within 20 kbp of a significantly responsive gene contribute to smoothed lines grouped by their genomic positional relation, see key. Genes proximal to a repressed or induced gene are summarized by red and black lines, respectively. In the first panel the blue line represents the genome-wide average as measured by the 10–20 kb proximal region. (B) The CG8498 and Piezo locus is an example of divergent promoters responding in opposing directions. This exemplifies the trend shown in A where divergent promoters do not tend to consistently respond as strongly. Note that since CG8498 and Piezo are expressed at different levels, the maximal height to the left of the vertical dashed line is 1000 RPKM and the maximal height to the left is 75 RPKM. (C) The CG43389 and CR43626 locus is an example of “operon-type” promoter structured genes responding in the same direction. This exemplifies the trend shown in A where “operon-type” promoters tend to respond consistently, particularly for induced genes.

