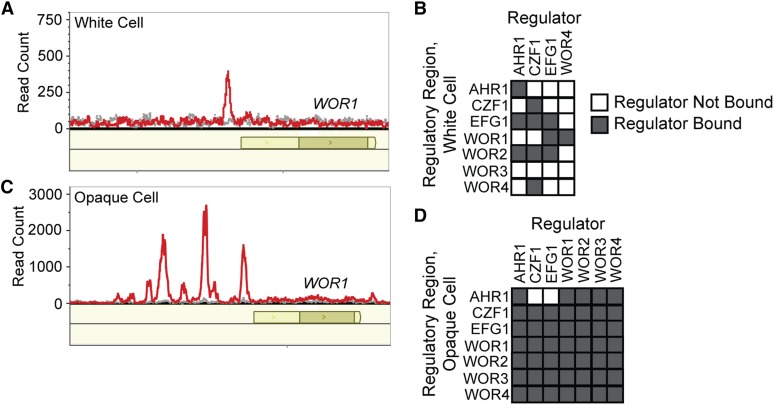
Figure 3.
Wor4 localization across the genome as determined by ChIP-seq. (A) Wor4 binds to the upstream region of Wor1 in white cells. ChIP-seq reads for Wor4-GFP in red and the untagged control in gray. Open reading frames are represented as dark yellow boxes, and untranslated regions are represented in light yellow. Data are plotted using MochiView (Homann and Johnson 2010). (B) Regulatory circuit in white cells, incorporating Wor4 binding data from this study with previously published ChIP-chip studies of other regulators (Hernday et al. 2013). The charts indicate which regulators (columns) were enriched at the control region of each regulator (rows) (see Figure 1). (C) Wor4 binds to multiple positions in the upstream region of Wor1 in opaque cells. The data are displayed as in panel (A). (D) Regulatory circuit in opaque cells, incorporating Wor4 binding data from this study, as well as previously published ChIP-chip studies (Zordan et al. 2007; Hernday et al. 2013; Lohse et al. 2013).

