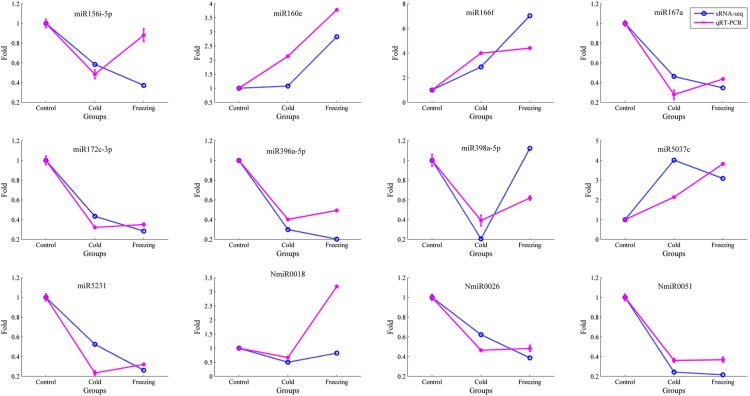
Figure 2.
Validation of the expression of 12 miRNAs in alfalfa using qRT-PCR. Expressional abundance of each miRNA gene in the control sample was set as 1, and fold changes of each miRNA gene relative to the control sample were calculated. Fold change values greater than 2 or less than 0.5 indicate upregulated or downregulated miRNAs. The blue plots are small RNA sequencing results, and pink represents the qRT-PCR results.

