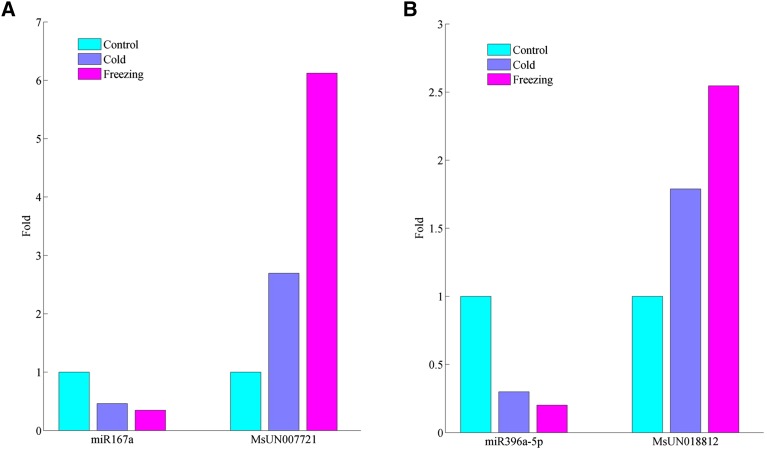
Figure 6.
Differential expression of miRNAs and their target genes in response to cold and/or freezing stresses. (A) miRNA167a vs. MsUN007721; (B) miRNA396a-5p vs. MsUN018812. The miRNA expression abundances were evaluated by small RNA sequencing using the TPM method, while target genes were estimated by RNA-seq data using the FPKM method. Their expression levels were adjusted by comparing them with control samples, and relative fold change (FC) values were explored. FCs greater than 2 or less than 0.5 were identified as upregulated or downregulated, respectively.

