FIGURE 2.
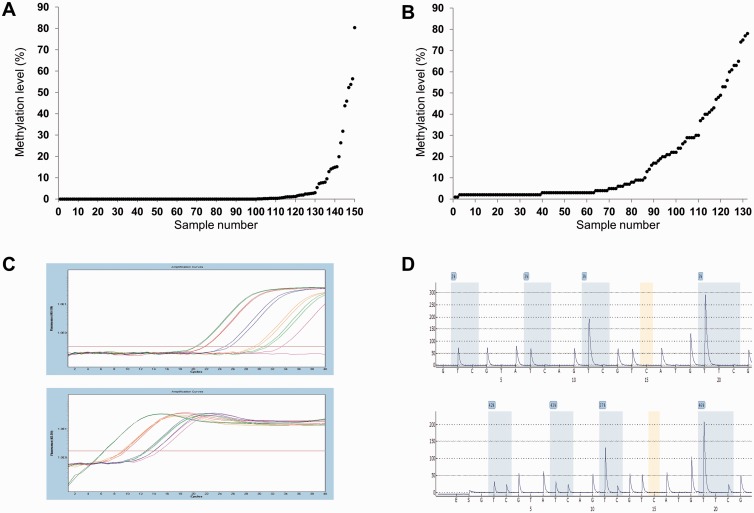
The quantitative methylation results using quantitative methylation-specific PCR (qMSP) and standard pyrosequencing. (A) Methylation levels obtained by qMSP plotted for each of the samples. (B) Methylation levels obtained by standard pyrosequencing plotted for each of the samples. (C) Examples of individual results from the MGMT qMSP assay and the Alu assay. The red curves represent the in vitro methylated DNA; the other curves represent individual samples that were analyzed in duplicate. (D) Examples of individual results from the standard pyrosequencing assay that interrogates 4 individual CpG sites.

