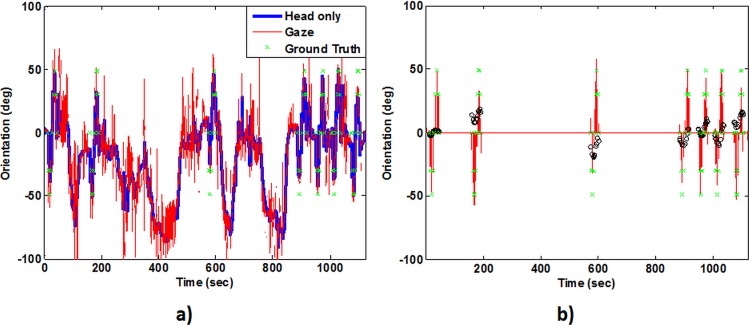
Figure 9.
Outputs for the gaze tracking experiment while walking with body turns. (a) The continuous data output for the head movement (blue line) and the gaze (red line) in the yaw direction. The walking speed between checkpoints was not kept constant by the subject. (b) Data values at the checkpoints only: red segments represent the gaze estimation, and black circles the deviation from the ground truth (green crosses).

