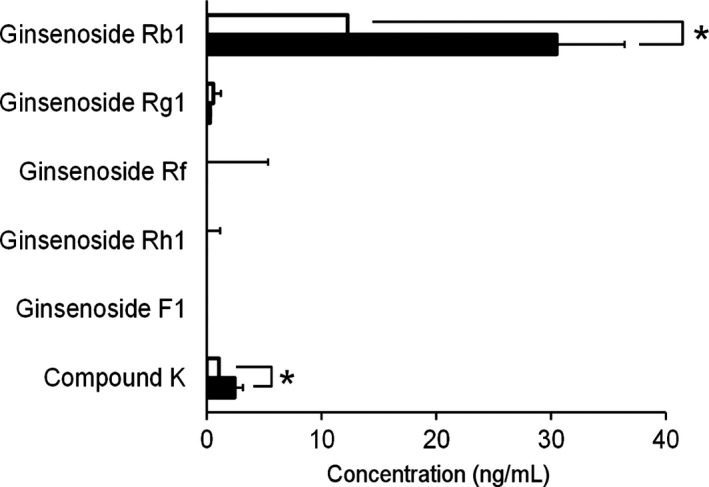
Figure 3.

Plasma concentrations of TU‐100 ingredients and metabolites in mice. Mice were treated with TU‐100 for 1 day (open bar) or 28 days (closed bar). Plasma samples were analyzed by LC‐MS/MS as described in Materials and Methods section. Data represent means ± SD. *P < = 0.05 (n = 6).
