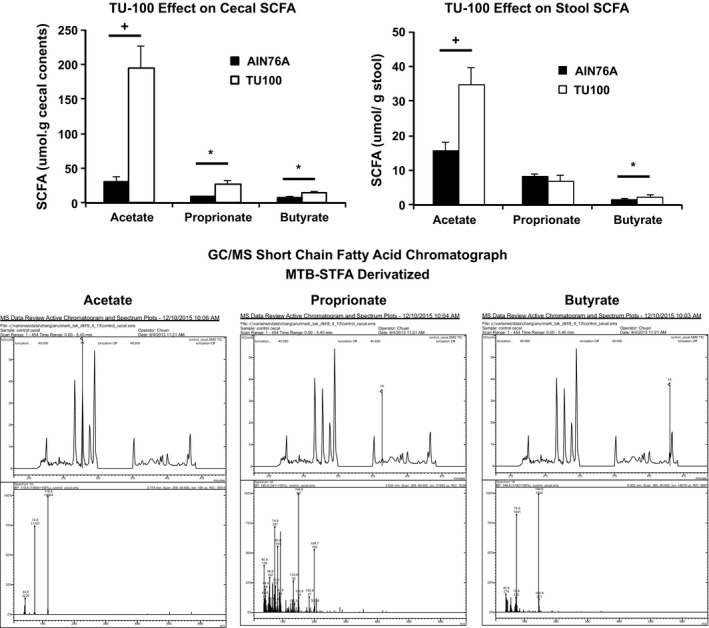
Figure 4.

Cecal and stool short‐chain fatty acids. Mice were fed TU‐100 for 28 days and cecal contents and stool from the same mice were analyzed for short‐chain fatty acids as described in Materials and Methods section by GC‐MS. Data represent means ± SE. *P < 0.05, +P < 0.01 (n = 7). The bottom set of panels is analysis of a cecal sample from a mouse fed diet without TU‐100. The chromatographs are marked with vertical lines labeled 1A for acetate (left), propionate (middle), and butyrate (right). The m/z for these peaks is presented below and confirmed identification as these short‐chain fatty acids.
