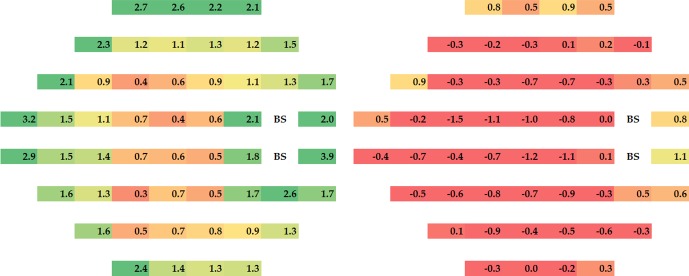
Figure 1.
Mean threshold change in dB from baseline to 6 months at each test location within each treatment group, with positive values indicating improvement with the treatment failure subjects included. Note that the greatest changes occurred in the periphery and around the blind spot but improvement occurred across the visual field. Green: 2 dB or more improvement. Yellow: 1–2 dB improvement. Red: less than 1 dB improvement.

