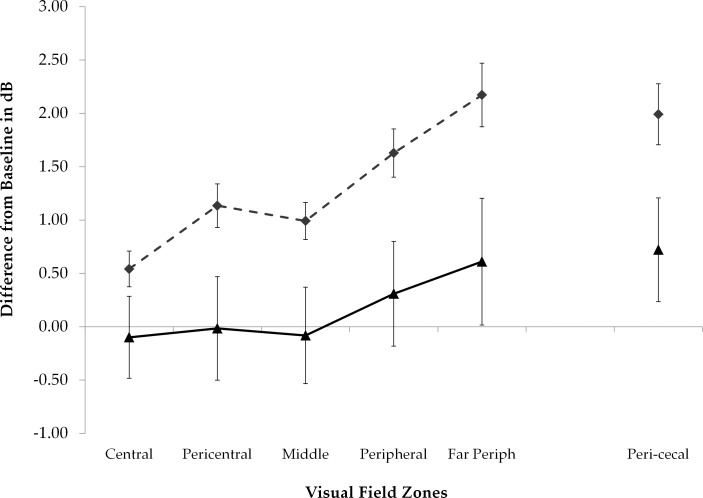
Figure 3.
Mean threshold changes (dB) from baseline to 6 months within each treatment group by zone; the zones are described in Supplementary Figure S1. The acetazolamide treatment group is represented by the dashed line and the placebo group is represented by the solid line. Error bars denote one standard error. Zones of increasing eccentricity are shown on the left and the pericecal zone adjacent to the blind spot is shown on the far right.

