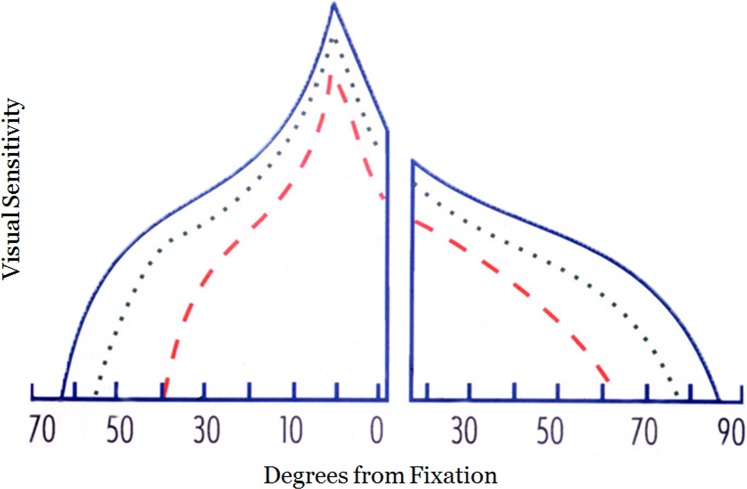
Figure 5.
Schematic of the visual island of a right eye in IIH modelling damage due to high- and low-grade papilledema. Blue lines represent the profile of the normal visual island through the horizontal meridian. Green dotted line: represents visual loss in the eye with low-grade papilledema. Red dashed line: the visual loss in the eye with high grade papilledema. The x-axis numbers are degrees of visual field eccentricity for a right eye.

