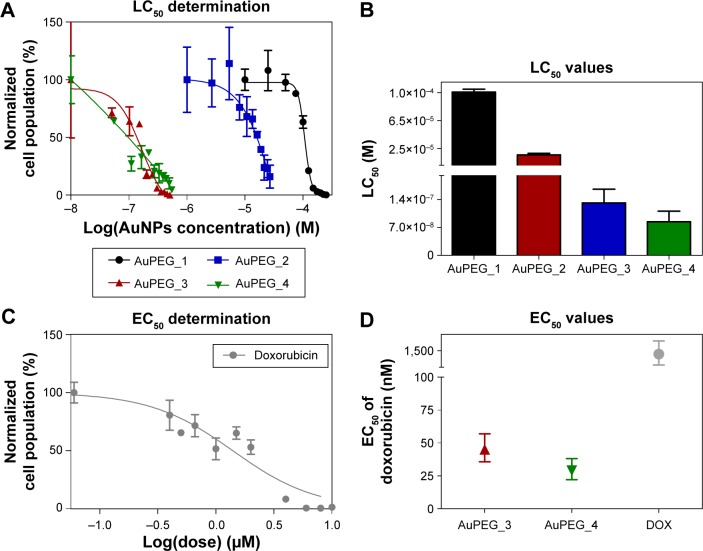
Figure 8.
Determination of LC50 and EC50 values.
Notes: (A) Percentage of live cells as quantified by flow cytometry after exposing PANC-1 cells to various concentrations of PEG-AuNPs (ranging from 0 to 2.5×10⁻⁴ M) for 24 hours. Dose–response curves are fitted to extrapolate the LC50 value of PEG-AuNPs. (B) LC50 values of PEG-AuNPs as extrapolated from dose–response curves. (C) Percentage of live cells as quantified by flow cytometry after exposing PANC-1 cells to various concentrations of DOX (ranging from 0 to 8 μM) for 24 hours. The dose-response curve is fitted to extrapolate the EC50 value of DOX. The scale bar is not comparable to graph (A). (D) Comparison among the EC50 values of doxorubicin loaded onto AuPEG_3, AuPEG_4, or tested in its molecular form (DOX). (B, D) LC50 and EC50 values are reported as mean ±95% confidence interval.
Abbreviations: PEG, polyethylene glycol; AuNPs, gold nanoparticles; LC50, half-maximal lethal concentration; DOX, doxorubicin; AuPEG, PEG-coated AuNPs; EC50, half-maximal effective concentration.

