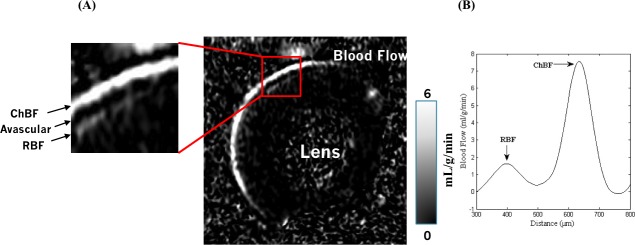
Figure 2.
(A) Layer-specific blood flow map of a C57BL/6J mouse eye at a resolution of 42 × 42 × 400 μm. Blood flow maps detect choroidal and retinal vascular layers with the avascular zone in between. Scale bar: indicates the blood flow range. (B) Retinal and choroidal blood flow profiles (mL/min/g) were calculated from the signal intensities of labeled images such as in Figure 2A.

