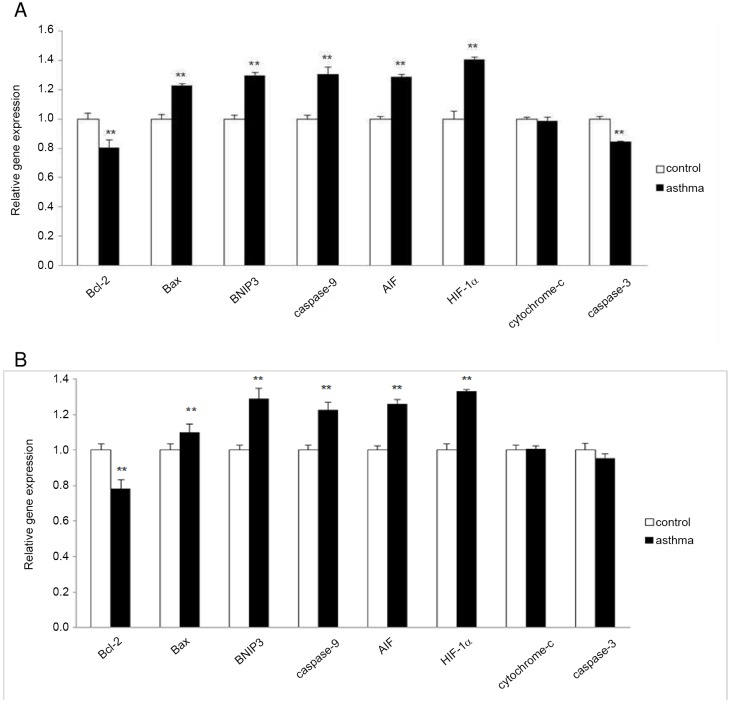
Fig 7. Relative mRNA level of several apoptosis-related genes.
(A) Equal amounts of RNA from 5 control or experiment mice were mixed well and split into two groups before cDNA synthesis. (B) Equal amounts of RNA samples from the 10 mouse testes were aliquot individually and then subjected to cDNA synthesis respectively. Transcriptional expression of indicated genes was measured by real-time qPCR. Data were presented as means ± SD (n = 5). ** indicates a very significant difference (P<0.01), compared with the control group.

