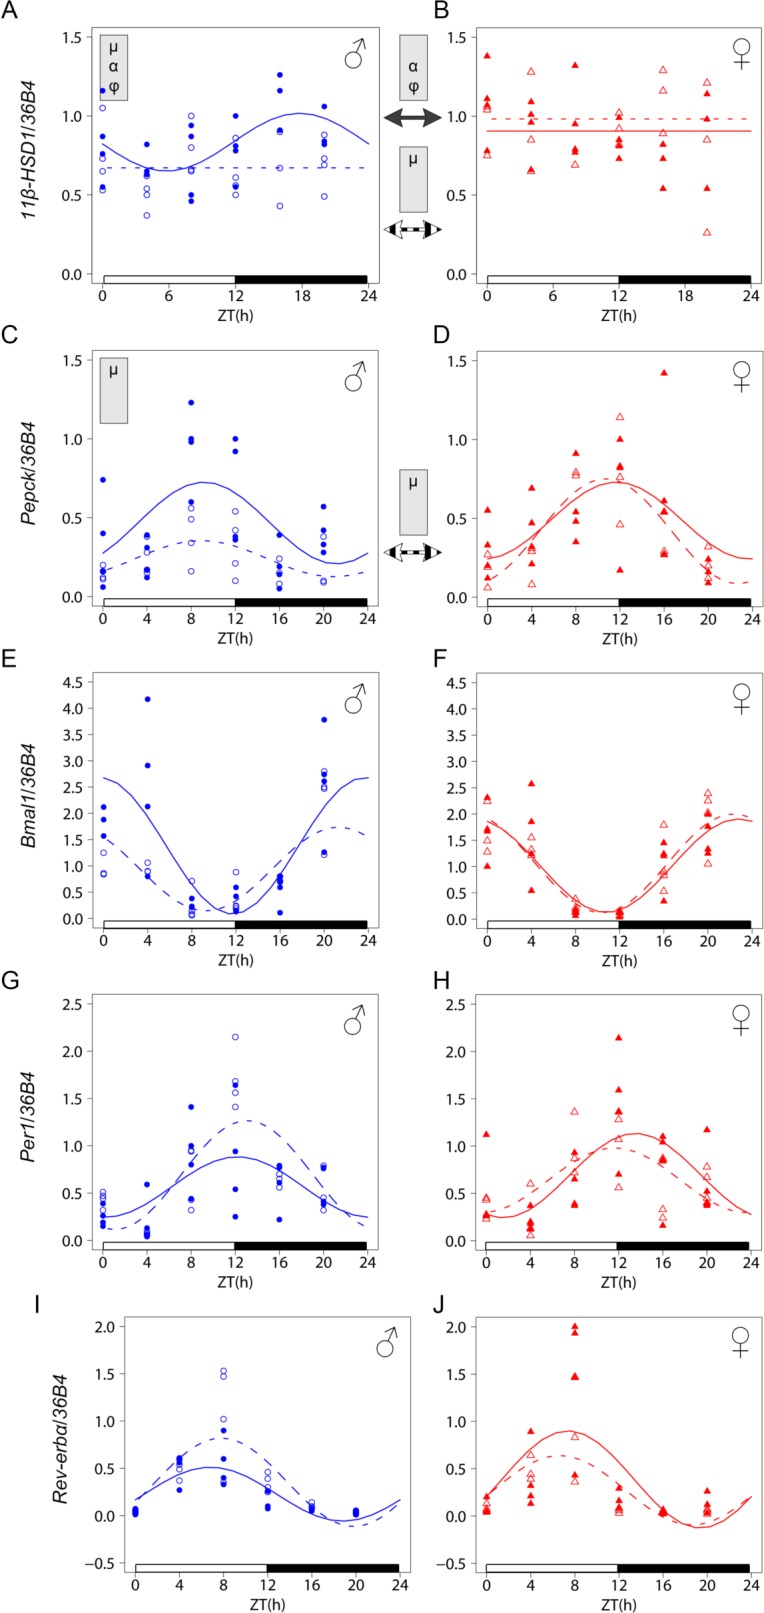
Fig 5. Analysis of circadian gene expression in the liver of WT and Lxrα-/- mice.

Diurnal mRNA expression of liver 11β-HSD1 (A, B), Pepck (C, D), Bmal1 (E, F), Per1 (G, H) and Rev-erbα (I, J) was compared using qRT-PCR in WT (plain line) and Lxrα-/- mice (dashed line). For each time point, 3–4 mice were used. Cosinor-based non-linear regression was used for curve fitting. The ZT0 time point is double plotted for visualization purpose. Expression data were normalized to the constitutively expressed 36B4 mRNA. The white and black bars represent the light and dark phases, respectively. Statistically significant differences in cosine fitting parameters (p<0.05) between wild type and Lxrα-/- mice or between male and female of the same genotype is indicated in the grey box at the top of the corresponding graph or between graphs (WT: plain arrow, Lxrα-/-: dashed arrow). μ, α and φ indicate a difference in mean level, amplitude and acrophase, respectively.
