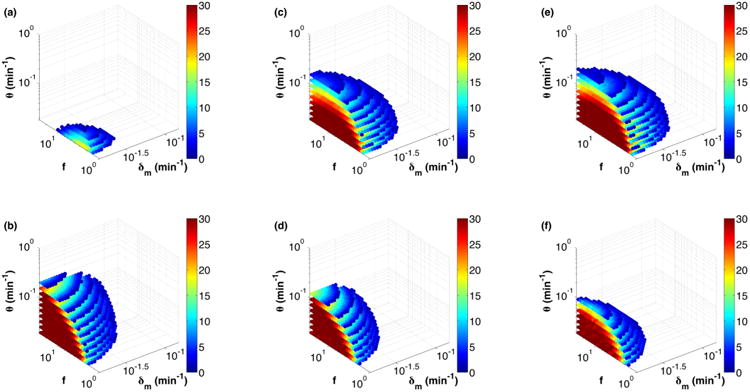
Fig. 3.

(Color online) Parameter space of oscillatory solutions on a logarithmic scale for RTC (top) and ATC (bottom) with increasing DNA binding sites. The color map shows the number of ρf values that exhibited oscillations for each combination of f, δm, andθ. [(a) and (b)] Single DNA binding site for RTC and ATC, [(c) and (d)] three independent binding sites for RTC and ATC, and [(e) and (f)] three synergistic binding sites for RTC and ATC, where repression (activation) strength is f2 when more than one repressor (activator) is bound.
