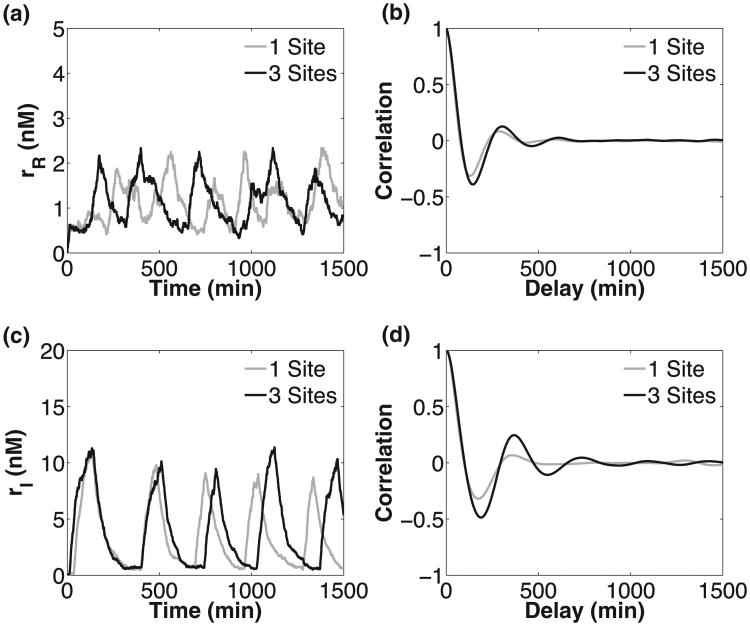
Fig. 6.
Sample stochastic trajectories for one and three binding sites for RTC (a) and ATC (c), and their autocorrelation functions [(b) and (d)]. The variable parameter values (θ, δm, ρf, f) were fixed to (0.02 min−1, 0.0159 min−1, 0.8928 min−1, 3.63) for the RTC and (0.02 min−1, 0.0186 min−1, 0.1781 min−1, 30) for the ATC. We chose parameters that produced oscillation over the largest range of DNA unbinding rates. The rest of the parameters are given in Table I.

