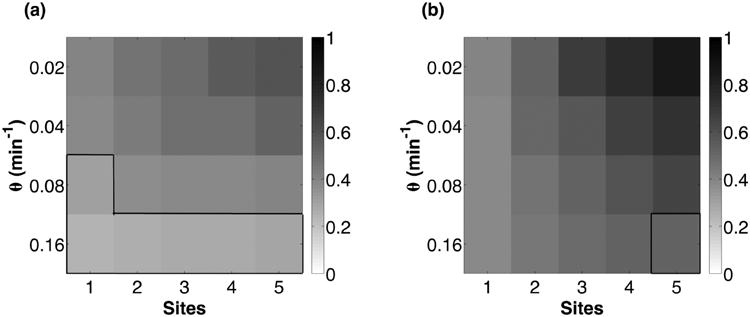
Fig. 7.

The normalized autocorrelation function decay rate for the RTC (a) and ATC (b) for varying θ and number of binding sites. All parameters, except θ, are the same as in Fig. 6. Boxed, outlined regions are parameters past the bifurcation point (θmax) where deterministic oscillations are unsustainable and damped, yet exhibit stochastic excitable oscillations.
