
Figure 3. Regulation of PG receptor expression by genistein in LNCaP, PC-3 and primary prostatic epithelial cells.
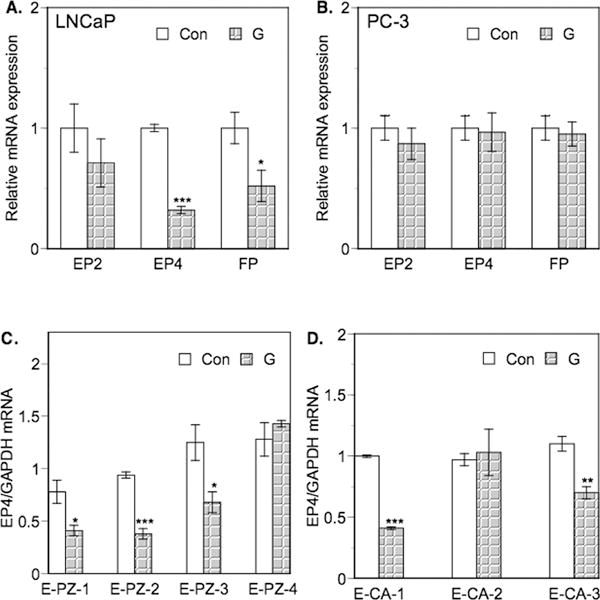
Sub-confluent cultures of LNCaP and PC-3 were treated with 0.1% ethanol (control, Con) or 10 μM genistein (G) for 24 h. Total RNA was extracted and EP2, EP4 and FP mRNA expression was determined using real-time RT-PCR as described in Materials and Methods. Values were normalized to TBP mRNA levels and the ratios are given as fold change over control set at 1 (Panel A). Values represent mean ± SE of at least three individual experiments. * p< 0.05 and *** p< 0.001 as compared to control. The primary cell cultures were treated with genistein and analyzed for EP4 receptor levels as described earlier. EP4 PG receptor mRNA levels were normalized to GAPDH mRNA levels and the ratios are given as fold change over control set at 1. Values represent mean ± SE from three experiments. * p< 0.05, ** p< 0.01 and *** p< 0.001 as compared to vehicle. EP4 mRNA expression in normal epithelial cells is shown in Panel B and that in cancer-derived epithelial cells is shown in Panel C.