
Figure 4. Effect of genistein on PGE2 levels and cell growth.
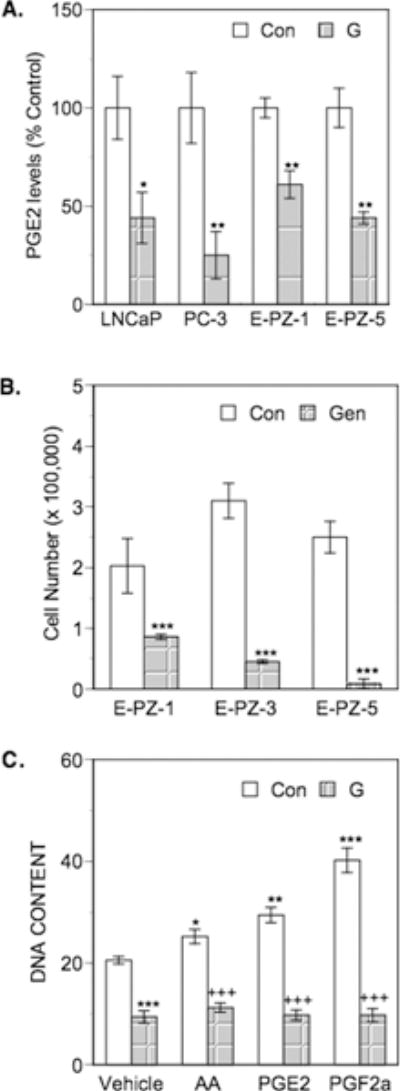
Panel A: Sub-confluent cultures of LNCaP, PC-3 and the primary normal prostatic epithelial cells E-PZ-1 and E-PZ-5 were treated with 0.01% ethanol vehicle (control, Con) or 10 μM genistein (G) for 72 h. Conditioned media from vehicle and genistein-treated cultures were collected and PGE2 levels were determined using an EIA kit as described in Materials and Methods. Values are given as a percent of PGE2 levels in vehicle-treated control set at 100%, which corresponded to 0.262 ± 0.04 pg/μg protein in LNCaP, 5.9 ± 1.2 pg/μg in PC-3, 175 ± 8.6 pg/μg in E-PZ-1and 0.029 ± 0.003 pg/μg in E-PZ-5 cells. Values represent mean ± SE from three experiments. *p< 0.05 and ** p< 0.01 as compared to control.
Panel B: Primary prostatic epithelial cells derived from normal human prostate tissue were seeded and cultured in defined growth media containing vehicle (0.01% ethanol) or 10 μM genistein. Cell growth at the end of 10 days was determined by a high-density growth assay as described in Materials and Methods. Values represented are mean ± SE from three experiments. *** p< 0.001 as compared to control.
Panel C: Semi-confluent LNCaP cells cultures in RPMI + 2% FBS were treated with 0.1% ethanol vehicle (control, Con), arachidonic acid (AA, 3 μM), PGE2 (10 μM) or PGF2α (10 μM) in the absence or presence of 10 μM genistein (G) added to the media. Fresh media and the various agents were replenished at the end of 3 days. Cell growth was determined at the end of 6 days by measuring DNA content as described in Materials and Methods. Values are expressed as μg of DNA/well and represent mean ± SE of at least three experiments. * p< 0.05, ** p< 0.01 and *** p< 0.001 when compared to vehicle. +++ p< 0.001 when compared to AA, PGE2 or PGF2α alone.