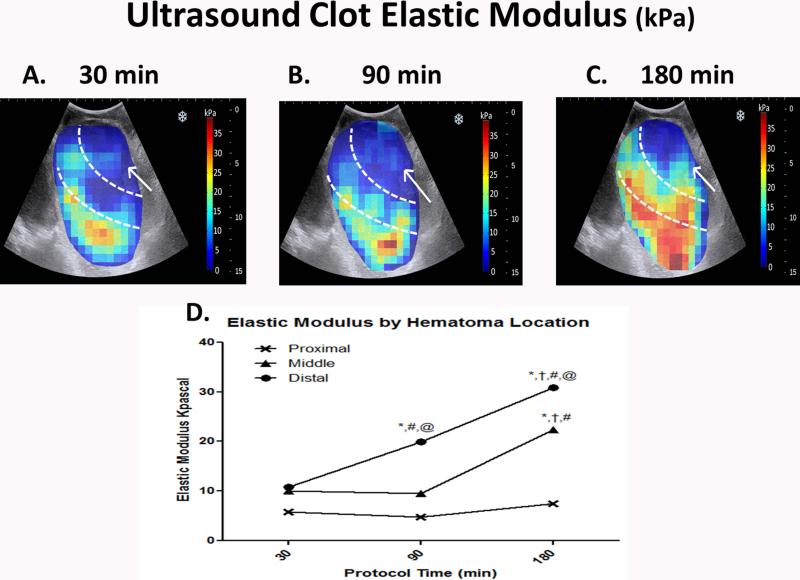
Fig. 3.
Color-coded heat maps of in vivo clot elastic modulus of perivascular hematomas measured using ultrasound elastography in a swine model of femoral artery injury. Measurements were taken serially at 30, 90 and 180 min after onset of bleeding (A–C). Separate measurements were taken closest to the origin of bleeding (Proximal), in the middle portion (Middle) and at the furthest distance away (Distal) and these regions are demarcated by the white interrupted lines. Mean measurements were compared using two-way ANOVA with Tukey adjustment for multiple comparisons (D). *P < 0.001 vs. the same location at 30 min. †P < 0.001 vs. the same location at 90 min. #P < 0.001 vs. Proximal location at the same protocol time. @P <0.001 vs. Middle location at the same protocol time. Origin of bleeding is marked by the white arrow.Elastic modulus within the hematoma progressively increased in the distal and middle portions of the hematoma over time relative to the origin of bleeding (arrow).

