Figure 8.
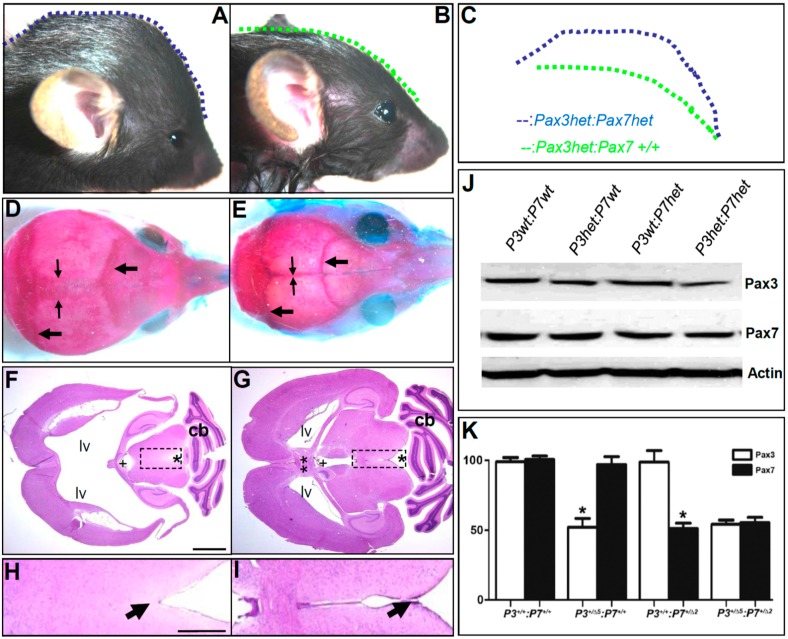
Pax3 and Pax7 play a combinatorial role in cerebral ventricular development. (A–C) Lateral views of Pax3+/Δ5/Pax7+/Δ2 compound heterozygous mutant (A) and control (B) P20 littermates, with lateral profiles depicted by dotted lines and compared side-by-side to highlight the large domed cranium in Pax3+/−/Pax7+/− mutant (C); (D,E) Skeletal preps of heads from animals in (A,B); only the compound mutant (D) displays sagittal (narrow arrows) and transverse (thick arrows) suture fusion defects; (F,G) Hematoxylin and eosin sections reveal that the mutant lateral ventricle (F) is dilated and there is a loss of structure, when compared to control (double asterisks, G). The normal anterior segment of the third ventricle (plus sign), aqueduct (asterisk), and cerebellum (c,b) are indicated; (H,I) high power view of stenotic connection between mutant third ventricle and aqueduct (arrow, H), compared to normal third ventricle-aqueduct junction in control (I); (J,K) Results of representative Western blot analysis (J) and densitometric quantification (K) of Pax3 and Pax7 expression levels in individual E10.5 whole embryo lysates of designated genotypes (n = 3–5 of each genotype were analyzed). Note the gene dosage-dependent reduction (~50%) of corresponding protein level in various heterozygous compound offspring, relative to wild-type (P3+/+/P7+/+). Data are represented as mean ± SEM, * p < 0.05 by Student’s t-test (Pax3 versus Pax7 in each genotype). Scale bars: F,G = 2 mm; H,I = 0.5 mm.

