
Figure 2.
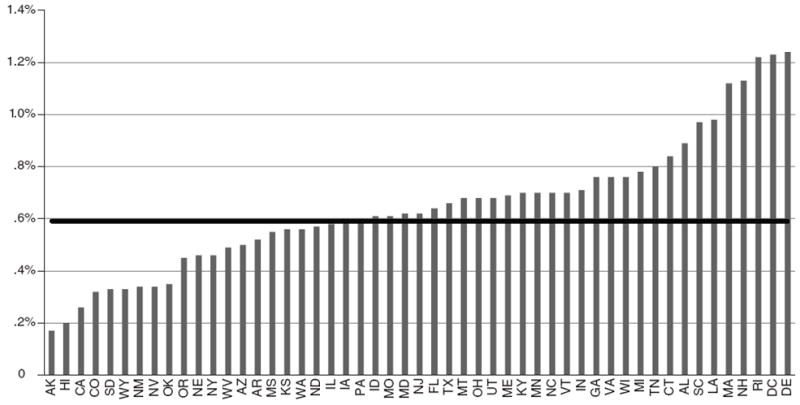
Percentage of adults >17 years old treated with stimulants in 2008, by statea
aData are standardized by age and gender. The bold horizontal line indicates average national treatment rate.
Official websites use .gov
A
.gov website belongs to an official
government organization in the United States.
Secure .gov websites use HTTPS
A lock (
) or https:// means you've safely
connected to the .gov website. Share sensitive
information only on official, secure websites.
Percentage of adults >17 years old treated with stimulants in 2008, by statea
aData are standardized by age and gender. The bold horizontal line indicates average national treatment rate.