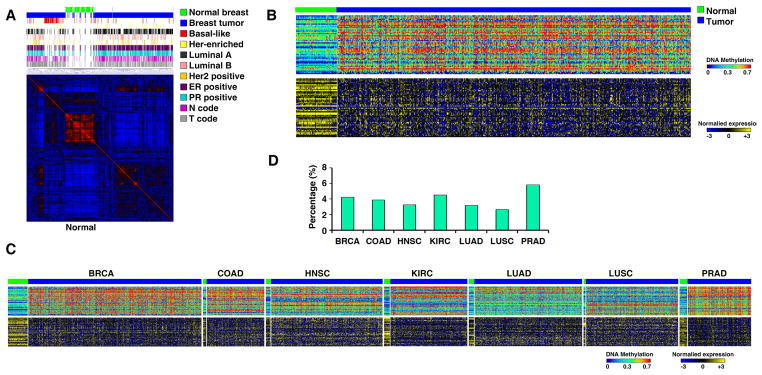
Figure 3. DNA methylation patterns in the promoter regions of lncRNA genes are altered in cancer.
A. NMF clustering of DNA methylation probes that are located in lncRNA promoters and whose methylation β-values had the largest variations across all breast specimens. B. Heatmaps of the methylation status (β-value, upper) in the promoter regions and the RNA expression level (lower) of the corresponding lncRNAs in breast specimens. C. Heatmaps of the methylation status of the lncRNA promoter regions and the RNA expression levels. D. A summary of the percentage of the CAESLG. See also Figure S3 and Tables S4 and S5.

