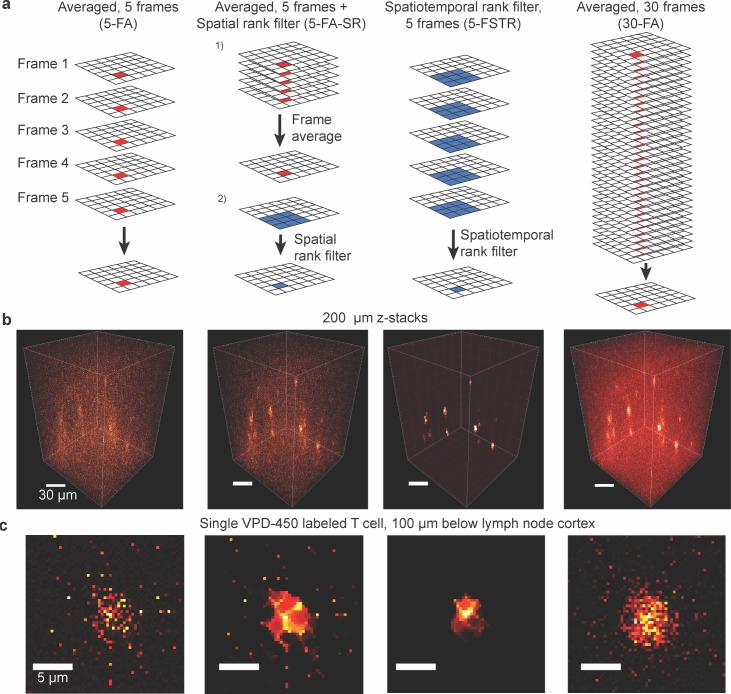
Fig 1. Comparison of frame averaging and rank filtering on VPD-450 labeled T cells within a lymph node.
(A) Schematic of various filtering methods. (B) 200 μm z-stacks created by (left-right) frame averaging (5-FA), frame averaging followed by spatial rank filtering with 0.7 μm (2 pixel) radius (5-FA-SR), spatiotemporal rank filtering with 0.7 μm (2 pixel) radius (5-FSTR), frame averaging with 6x as many frames (30-FA). Maximum contrast is set to 0.5 x the maximum pixel value in each image to show cells clearly against background. (C) 2D image of a single T cell 100 μm below the lymph node capsule

