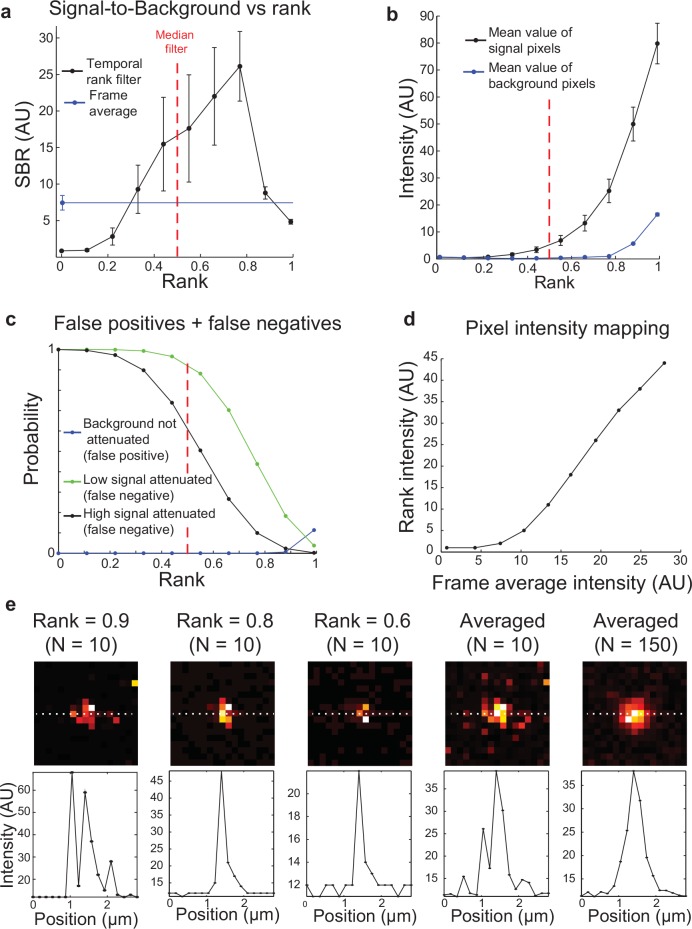
Fig 3. Performance of rank filters on bead images with different rank parameter values.
(A) Averaged signal to background of low average intensity pixels when rank filtered with various ranks. Error bars indicate standard deviation. (B) Mean values of bead pixels and background pixels used to generate (A). (C) Probability of attenuating high or low signal (false negative) or not attenuating background (false positive) based on binomial distribution cumulative distribution functions (N = 10) and the proportion of background pixels shown in Fig 2. (D) Mapping of intensity values corresponding to different average values compared to rank filter values. (E) Representative images of single sub-resolution beads and pixel linescans across them showing the failure to attenuate background when the rank parameter is set two high and the loss of dim pixels at the edges of the PSF when rank is set too low. Beads are 170 nm in diameter; pixels are 175 nm; theoretical Abbe resolution of the imaging system is 410 nm.

