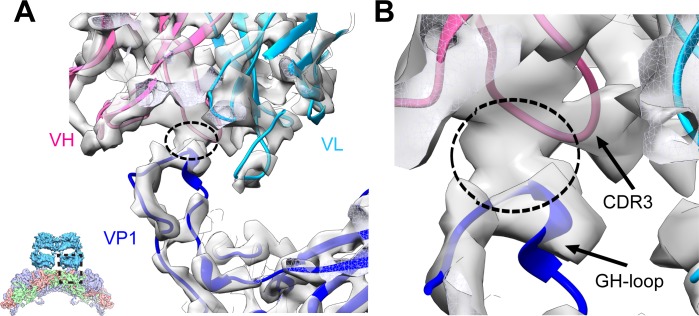
Fig 4. Binding interface between the D5 antibody and EV71 F-particle in the F-particle-Fab map.
(A) Overall view of the D5-EV71 binding interface located between the D5 Fab variable region and the VP1 of EV71. Models of heavy and light chains of the Fab, and VP1 of EV71 are shown in light purple, cyan, and blue, respectively. Cryo-EM density is shown in grey. A solid density connecting the EV71 VP1 and the Fab heavy chain is highlighted by dotted black circle. The visualization location with respect to the F-particle-Fab map is illustrated using a small panel in the lower left corner. (B) An expanded view of the D5-EV71 binding interface. Black arrows point to the CDR3 region of D5 heavy chain and VP1 GH-loop of EV71, respectively.

