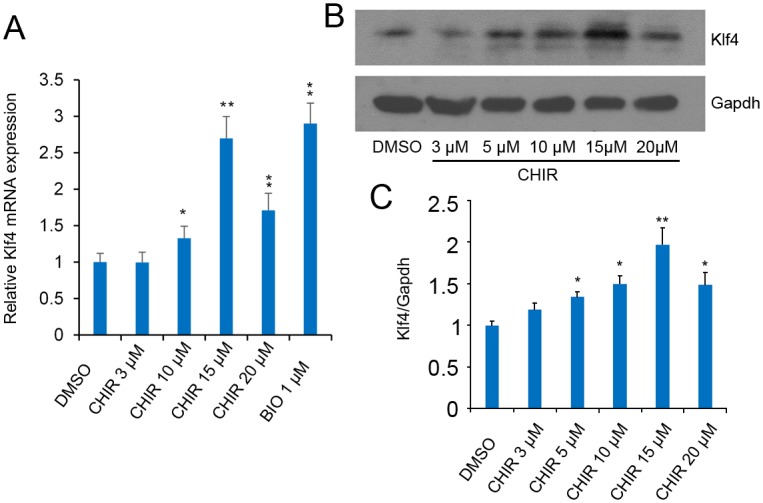
Fig 4. CHIR influences Klf4 expression in F9 EC cells.

(A): CHIR promotes Klf4 mRNA expression. F9 EC cells were treated with CHIR at a final concentration of 3, 5, 10, 15 and 20 μM respectively for 24 h, and Klf4 expression level was analyzed by RT-qPCR using the comparative Ct method. Gapdh was used to normalize template levels. Data are presented as the mean ± SD of three independent experiments (*p < 0.05; **p < 0.01). (B): CHIR promotes Klf4 expression. Representative western blot analysis of Klf4 in F9 EC cells after treatment with or without different indicated concentrations of CHIR for 48 h. Cell lysates were extracted and analyzed by western blot. Relative expression levels were compared with Gapdh, the experiments were repeated for three times. (C): Quantification of Klf4 in CHIR-treated J1 mESCs. The graph presents Klf4 levels normalized to corresponding Gapdh levels. Labeling intensity was expressed relative to that of the DMSO-treated mESCs (set as 1), error bar indicates standard deviation (*p < 0.05; **p < 0.01).
