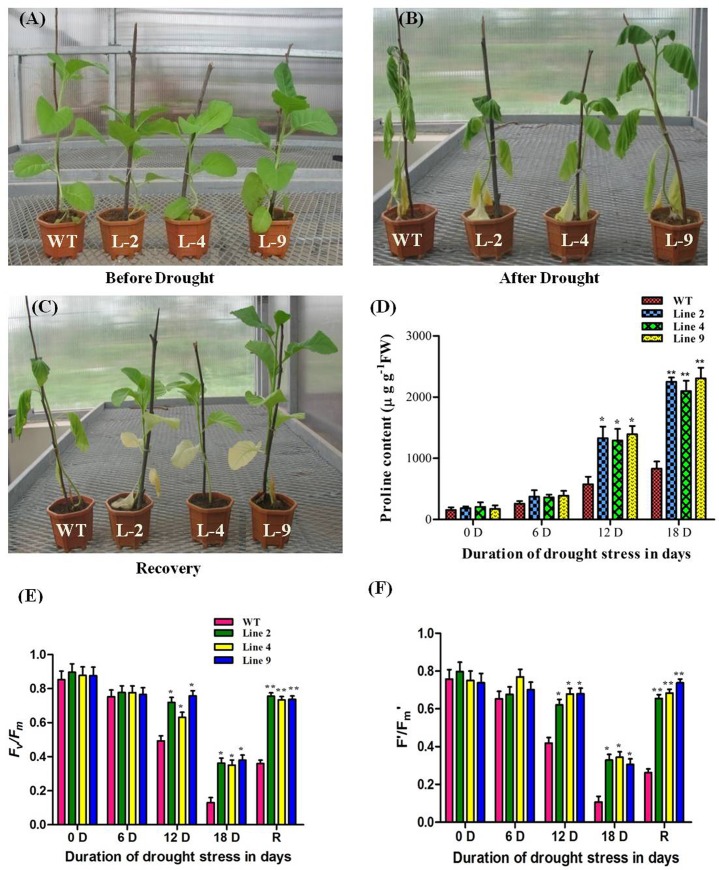
Fig 5. Morphological and physiological variation in WT and AdLEA transgenic plants under progressive drought stress.
(A) Plants before drought induction; (B) during severe drought; and (C) recovery phase after drought. (D) Estimation of proline content in leaves of WT and transgenic plants during drought stress. (E and F) Chlorophyll fluorescence measurements of plants during drought stress and recovery phase; Fv/Fm and Fʹ/Fmʹ for both WT and transgenic plants. Data plotted are the mean values ± SD from three independent experiments (n = 3; biological replicates). Single leaf from each plant constitute one biological sample. Statistical analysis was performed with two-way ANOVA (*P<0.05, **P<0.001).

