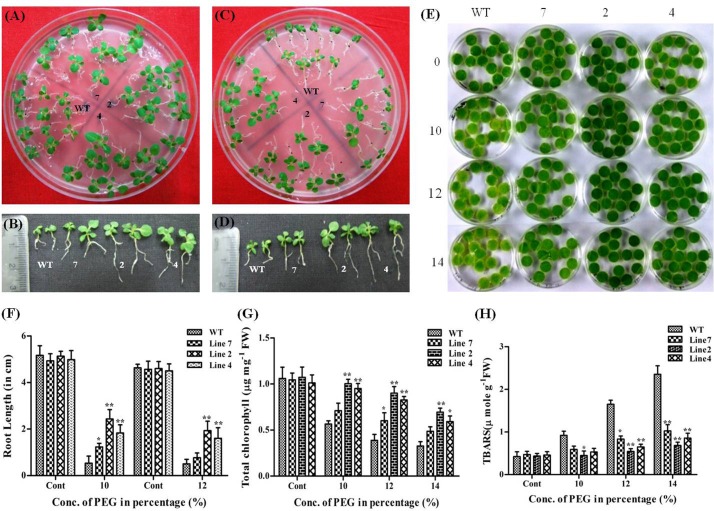
Fig 6. Effect of dehydration stress on AdLEA transgenic plants.
(A and C) WT and transgenic seedlings after growth on MS medium supplemented with 10% and 12% PEG respectively. (B and D) Morphology of individual seedlings after growth on 10% and 12% PEG respectively depicting differences in root length between the seedlings. (E) Phenotypic differences between WT and transgenic leaf discs floated in dose-dependent concentrations (0, 10, 12 and 14%) of PEG. (F) Graphical representation of root length in PEG-treated seedlings after 25 d and 20 d growth on 10% and 12% PEG respectively. (G) Graphical representation showing the chlorophyll content (μg mg-1 FW) in the leaf discs after 72 h of treatment with 10, 12 and 14% PEG. (H) Lipid peroxidation expressed as TBARS content (μmol g-1 FW) in leaf discs after 72 h of treatment with 10, 12 and 14% PEG. All the experiments were performed in triplicates and data represented as mean ± SD (n = 3; biological replicates). 11 seedlings per plate constitute one biological sample for seedling assay. 15 leaf discs from a single leaf constitute one biological sample for disc senescence assay. Statistical analysis was performed with two-way ANOVA (*P<0.05, **P<0.001).

