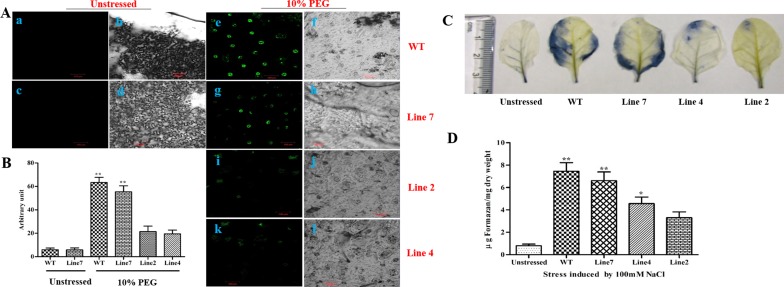
Fig 10. ROS detection in leaf epidermal cells by confocal microscopy and quantification of ROS in leaves using NBT staining.
(A) Fluorescence levels in WT and transgenic plants before and after treatment with PEG as shown in confocal microscopy. Bright field images of WT and transgenic plants are also displayed. Stomata with water treatment. (a and b) WT; (c and d) representative transgenic line 7. Stomata after treatment with PEG. (e and f) WT; (g and h) transgenic line 7; (i and j) transgenic line 2; (k and l) transgenic line 4. The figures are representative confocal images of stomatal guard cells (n < 1000) with three biological repetitions (Bar-100μm). (B) Quantification of ROS production in cells after H2DCFDA staining using ImageJ software. (C) Unstressed (untreated), WT, and transgenic leaves treated with 100mM NaCl as visualized after NBT staining. (D) Graphical representation of formazan content (μg mg-1 dry weight) in leaves of unstressed, WT, and transgenic leaves after treatment with 100mM NaCl. All the experiments were performed in triplicates and data represented as mean ± SD (n = 3; biological replicates). Single leaf from each plant constitute one biological sample. Statistical analysis was performed with one-way ANOVA (*P<0.05, **P<0.001).

