
Fig 1. Plakoglobin distribution during the development of first-generation teeth.
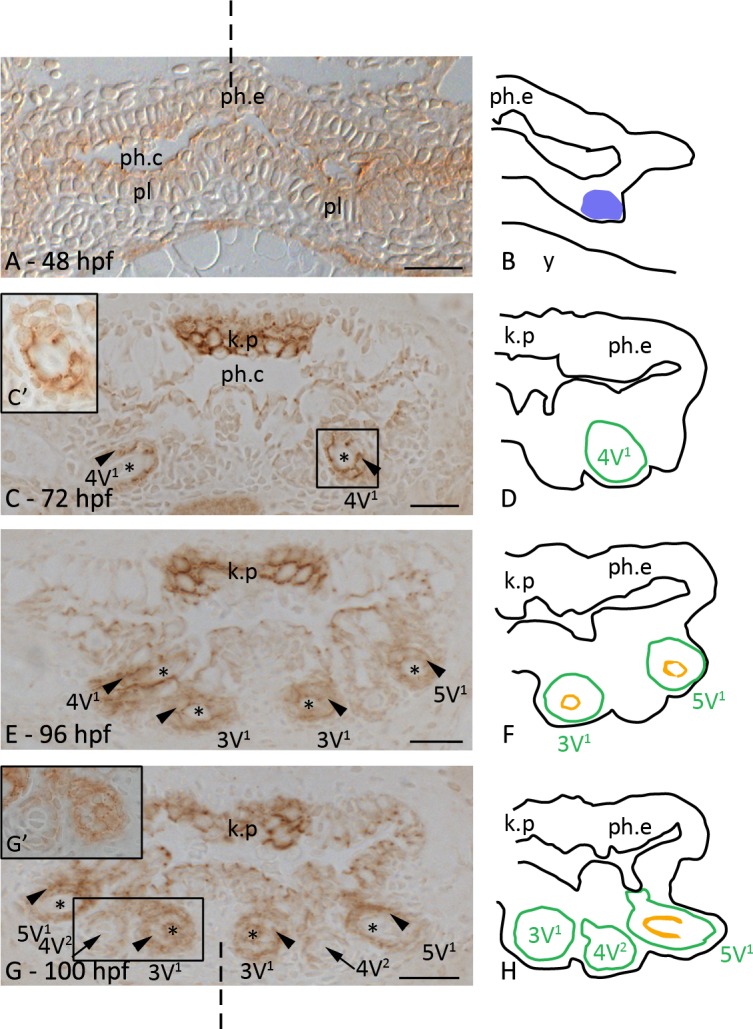
Cross-sections through the pharyngeal region of a 48 hpf (A), 72 hpf (C), 96 hpf (E) and 100 hpf (G) zebrafish embryo and corresponding schematic drawings in B, D, F and H. A,B: Initiation stage of tooth 4V1; the pharyngeal epithelium (ph.e.) expresses plakoglobin, in contrast to the mesenchymal cells. C,D: Morphogenesis stage of tooth 4V1; plakoglobin is clearly expressed at the cell borders of the epithelial-derived tissue (arrowhead). The keratinized pad (k.p.) opposite the developing teeth, strongly expresses plakoglobin. Boxed area in C is magnified in C’. E,F: Tooth 4V1 in late cytodifferentiation stage; teeth 3V1 and 5V1 in early cytodifferentiation stage. All teeth present display plakoglobin expression in epithelial-derived cell layers. G,H: Initiation of the first replacement tooth (arrow), 4V2. The epithelial outgrowth shows plakoglobin expression while the condensed mesenchyme is negative. Boxed area in G is magnified in G’. Diagrams: blue patch: placode; green line: contour of the tooth; orange: tooth matrix. Orientation: dorsal to the top, ventral to the bottom of each figure; dashed line indicates mediosagittal plane. Additional abbreviations: ph.c: pharyngeal cavity; pl: placode; *: dental papilla. Scale bars = 20 μm.