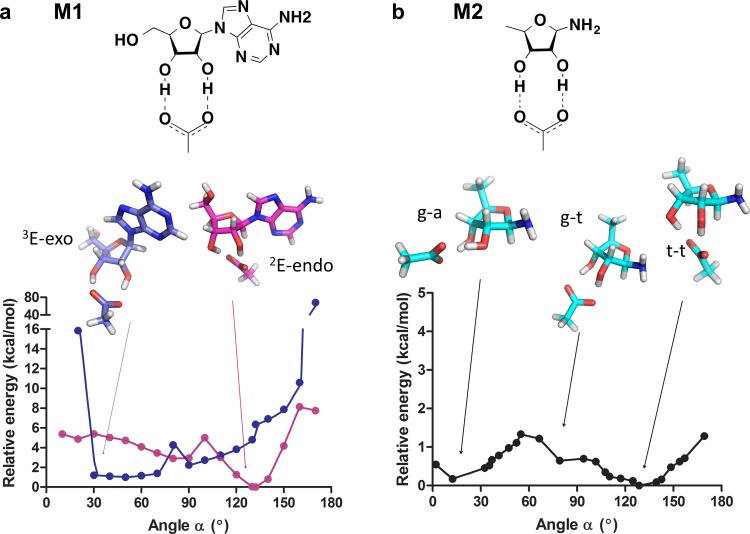
Fig 5. The potential energy of the bidentate ribose-carboxylate interaction as a function of the interaction angle.
The energies, in kcal/mol, are plotted as a function of the carboxylate-ribose angle α and are relative to the lowest identified energy for each of the models. (A) Structure and energy profile for model M1 indicating the optimized lowest-energy structures, 2E-endo (in magenta) and 3E-exo (in blue). (B) Structure and energy profile for model M2, in which g-a, g-t and t-t are fully optimized structures. Note that the energy plots for the two models are drawn on two different scales (data available in S3 Data).

