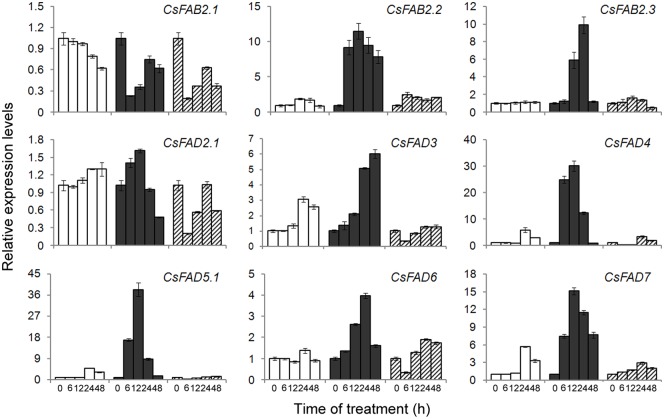
Fig 7. Expression profiling of the cucumber FAD genes in response to cold and heat stresses.
The relative expression levels of the FAD genes in the leaves of cucumber seedlings treated with normal (28°C/18°C, white bars), cold (8°C/8°C, black bars) or hot (38°C/28°C, hatched bars) temperatures were determined by qPCR. The expression level for each gene in the control plants at 0 h was normalized to 1.0. The data represent the means of three independent replicates ± sd.

