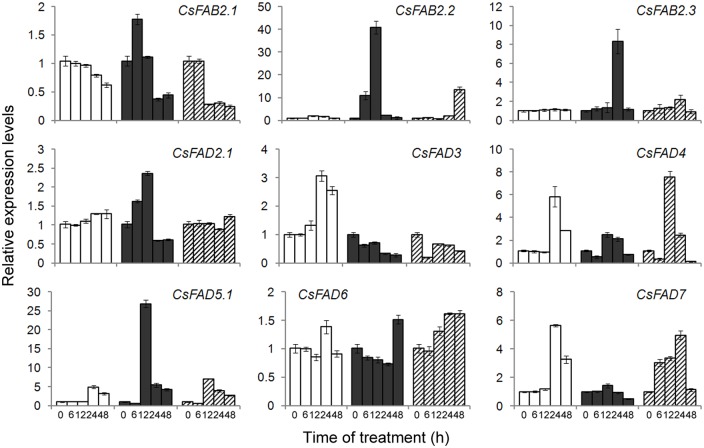
Fig 8. Expression profiling of the cucumber FAD genes in response to ABA and H2O2.
The relative expression levels of the FAD genes in the leaves of cucumber seedlings treated without (white bars) or with ABA (100 μM, black bars) or H2O2 (1 mM, hatched bars) were determined by qPCR. The expression level for each gene in the control plants at 0 h was normalized to 1.0. The data represent the means of three independent replicates ± sd.

