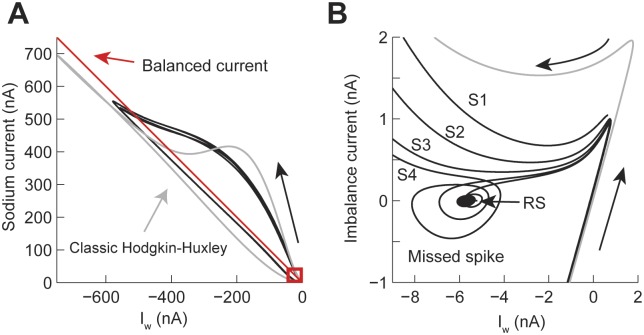
Fig 7. Phase plane analysis of the Transient Spiking pattern (see Fig 4B).
(A) Comparison of the current trajectories of the power-law (black) and classic (gray) Hodgkin-Huxley model. The power-law model had a fractional order derivative of η = 0.4 and input current I = 8 nA. The red box indicates the area of the attractor. (B) Phase plane of the attractor in A. S1 to S4 indicate spikes and RS is the resting state.

