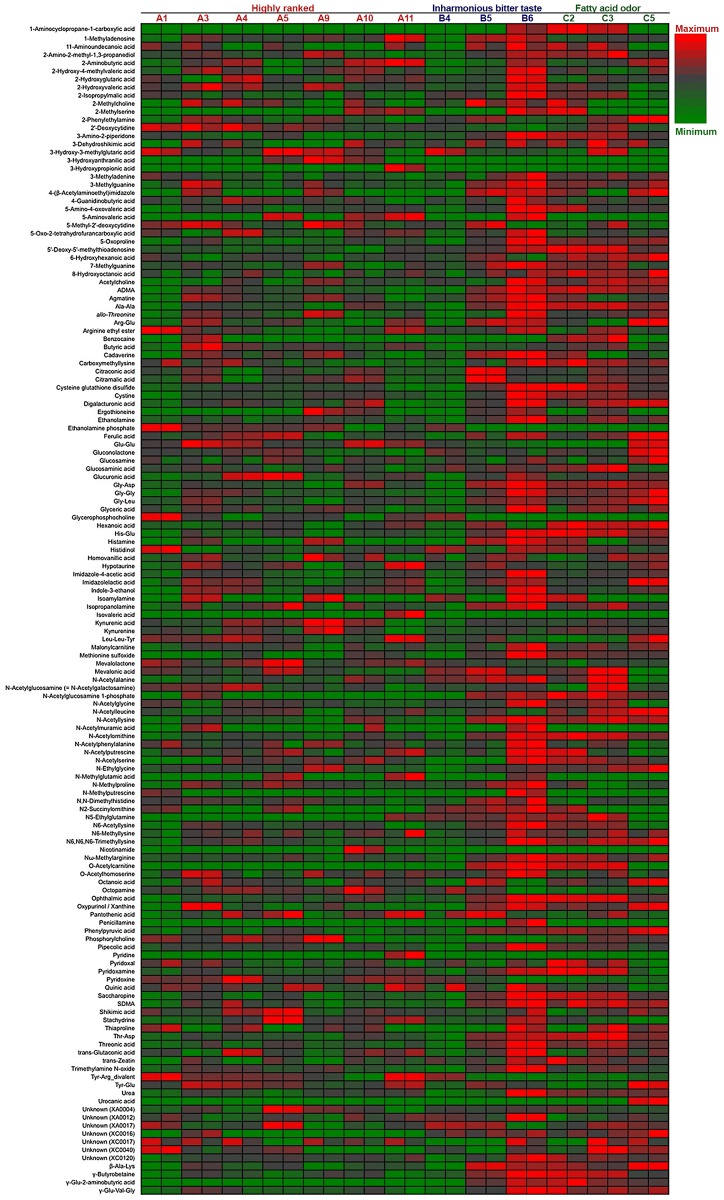
Fig 3. Relative heatmap for the metabolites of 13 sake samples.
Heatmap showing the metabolic profiles of 13 sake samples (7 of highly ranked sake, 3 of inharmonious bitter tasting sake, and 3 of sake with fatty acid odors) analyzed in duplicate. Maximum to minimum level is represented by a red-gray-green color scheme. The values of m/z of the unknown compounds XA0004, XA0012, XA0017 are 144.0292, 166.0154, and 186.1124, respectively, by the anion detection mode. The values of m/z of the unknown compounds XC0016, XC0017, XC0040, and XC0120 are 129.0646, 130.0977, 174.0861, and 298.0518, respectively, by the cation detection mode.

