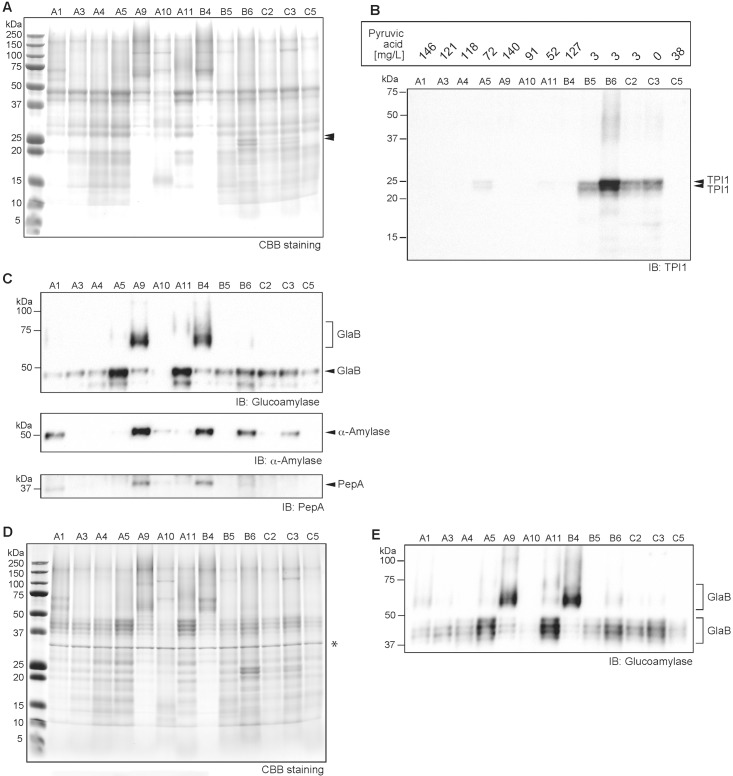
Fig 7. Protein profiles of 13 sake samples showing that yeast cellular protein leakage is linked to low sake quality.
A) Overall protein profiling by Coomassie brilliant blue (CBB) staining after SDS-PAGE. For each sample, 10 μL of denatured protein was applied to a lane, and 5 μL of marker was utilized. Protein bands indicated by double black triangles are Saccharomyces cerevisiae triosephosphate isomerase (TPI). B) Immunoblot analysis for S. cerevisiae TPI1 in sake. Pyruvic acid concentrations in sake (n = 2) determined by colorimetric assay is shown in the upper rectangle. C) Upper panel; Immunoblot analysis for glucoamylase (GlaB) derived from Aspergillus oryzae in sake. The N-glycosylated forms of GlaB were detected at 47 kDa and as a blurred band beyond 65 kDa. Middle panel; Immunoblot analysis for α-amylase. Lower panel; Immunoblot analysis for the acid protease, PepA. D) Protein profiling following PNGaseF treatment by CBB staining after SDS-PAGE. For each sample, 10 μL of denatured protein was applied to a lane, and 5 μL of marker was applied. The asterisk at 34 kDa shows PNGaseF. E) Immunoblot analysis for glucoamylase (GlaB) following PNGaseF treatment of sake. The blurred band and multiple bands at 55–70 kDa and 37–50 kDa correspond to GlaB.

