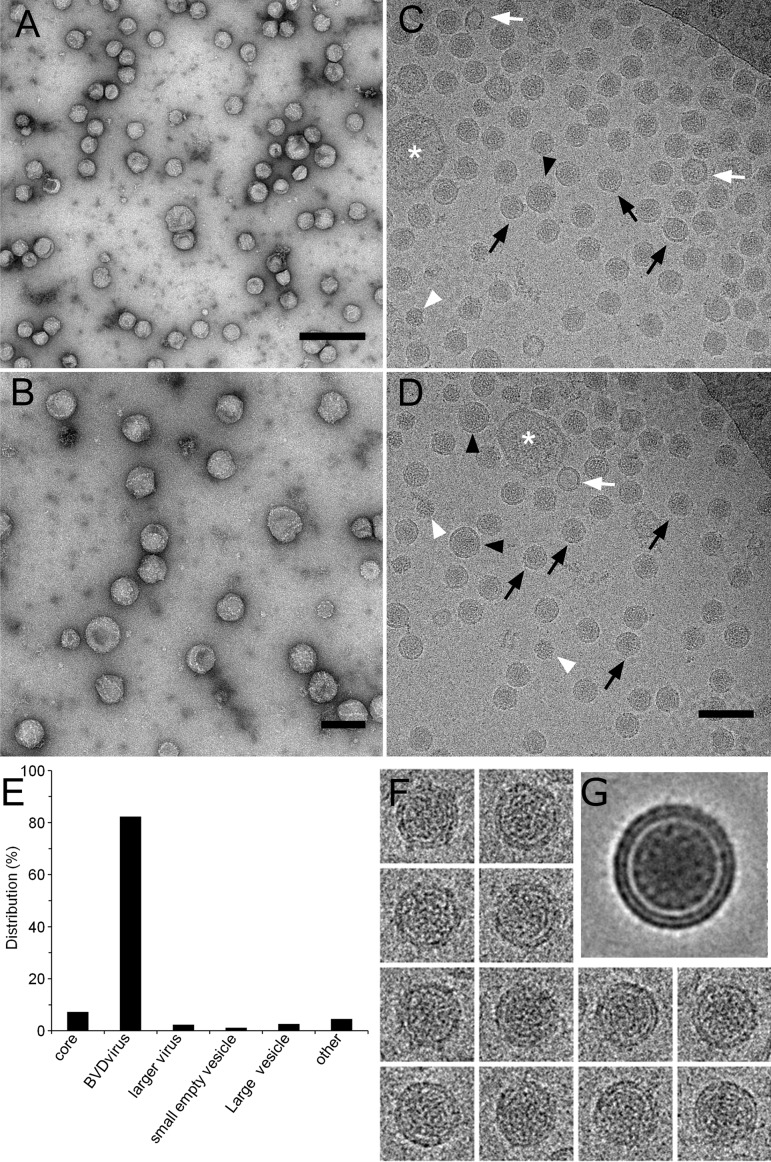
Fig 2. Analysis of purified BVDV particles by electron microscopy.
Visualization of purified BVDV particles after negative staining (A, B), or by cryo-electron microscopy (C, D). Black arrows: enveloped, capsid-containing particles of ~50 nm, black arrowheads: larger enveloped, capsid-containing particles, white arrowheads: non-enveloped, capsid-like particles, white arrows: small empty vesicles, white asterisks: large vesicles. (E) Quantification of different objects indicated in C and D. (F) examples of images used for virion reconstruction. (G) Virion reconstructed by projecting 160 images of 50-nm particles. Bars, 200 nm (A) or 100 nm (B,D).

