
Fig 5. Protein content of purified BVDV fraction.
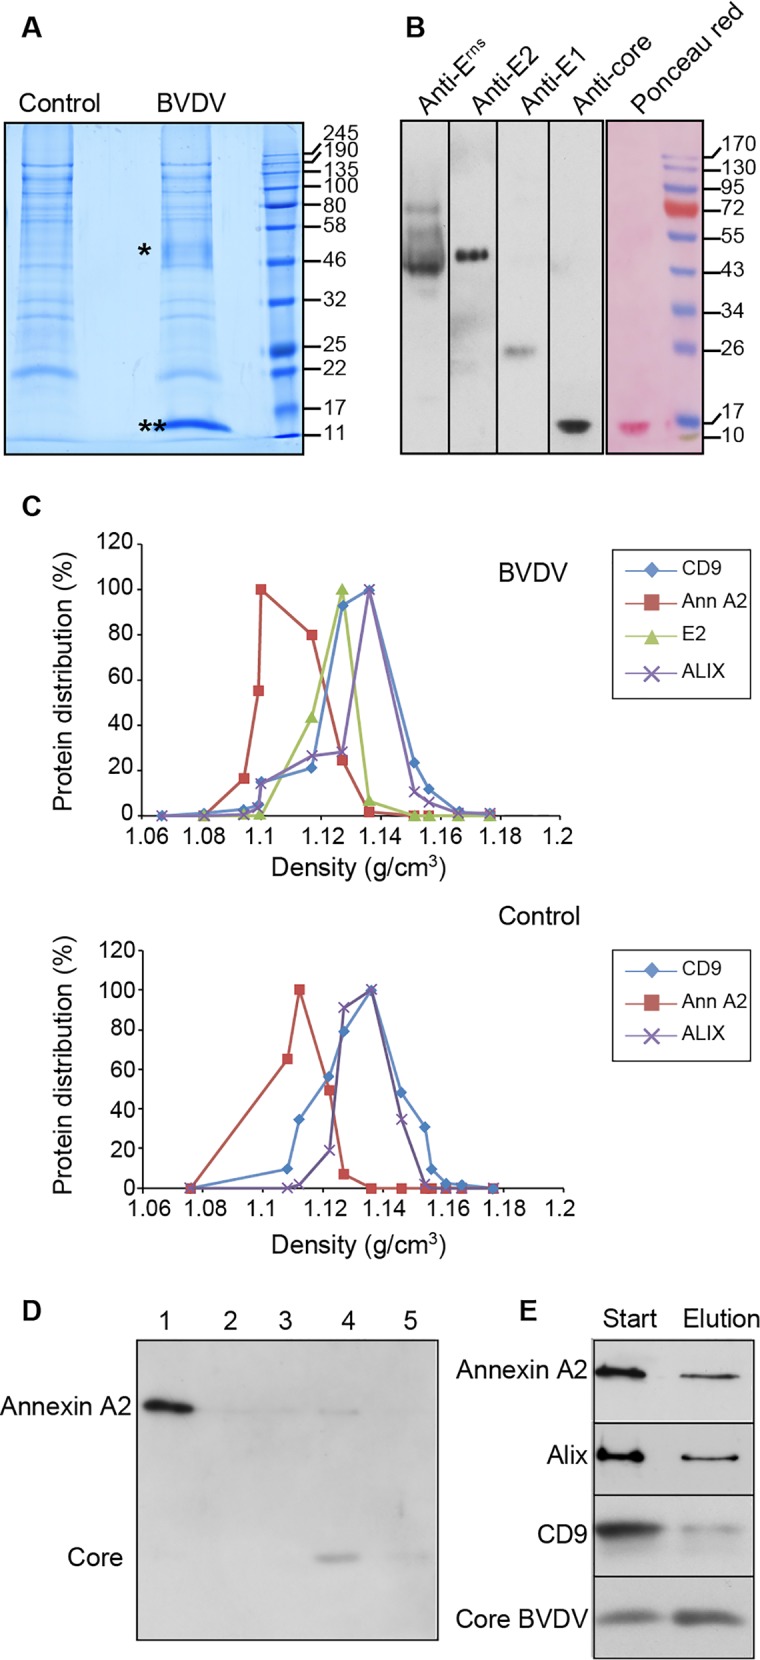
(A) A purified BVDV fraction and an equivalent fraction obtained from non-infected cells (control) were analyzed by SDS-PAGE under reducing conditions and colloidal Coomassie blue staining. Asterisk, Erns, double asterisk, core. (B) Immunoblot analysis under reducing conditions and Ponceau red staining of purified BVDV fraction. (C) Distribution of CD9, annexin A2, ALIX and BVDV E2 in sucrose density gradient of BVDV (top) and control (bottom) fractions. Bands were quantified by densitometry and plotted over fraction density. (D) Immunoblot analysis of annexin A2 and BVDV core in flow through (1), PBS washes (2 and 3) and 0.4M NaCl elution (4 and 5) fractions of cellulose-sulfate column. 1:50 of each fraction was loaded on the gel. (E) Immunoblot analysis of Annexin A2, ALIX, CD9 and core in BVDV fractions before and after cellulose sulfate chromatography. 1:20 of input and eluted fraction were loaded on the gel.