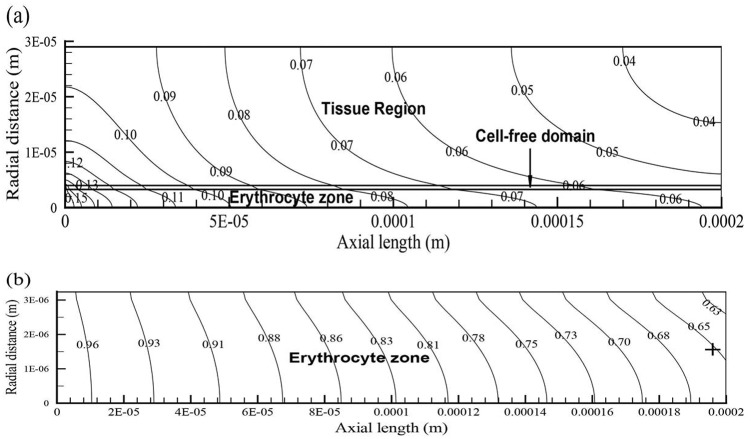
Fig 3. Oxygen levels and hemoglobin saturation contours of the capillary-tissue system.
Figure (a) displays the oxygen isoconcentration contours in the capillary and in the cortical tissue for CMRO2 = 250 μmol/100g/min and CBv = 0.9 mm/s 3 s after the increase in CBv. Figure (b) shows the distribution of hemoglobin saturation in the RBC region for the abovementioned CMRO2 and CBv. Hemoglobin saturation (sO2) values, referred to in the manuscript, were probed at the rightmost side of the RBC domain marked by the cross.

