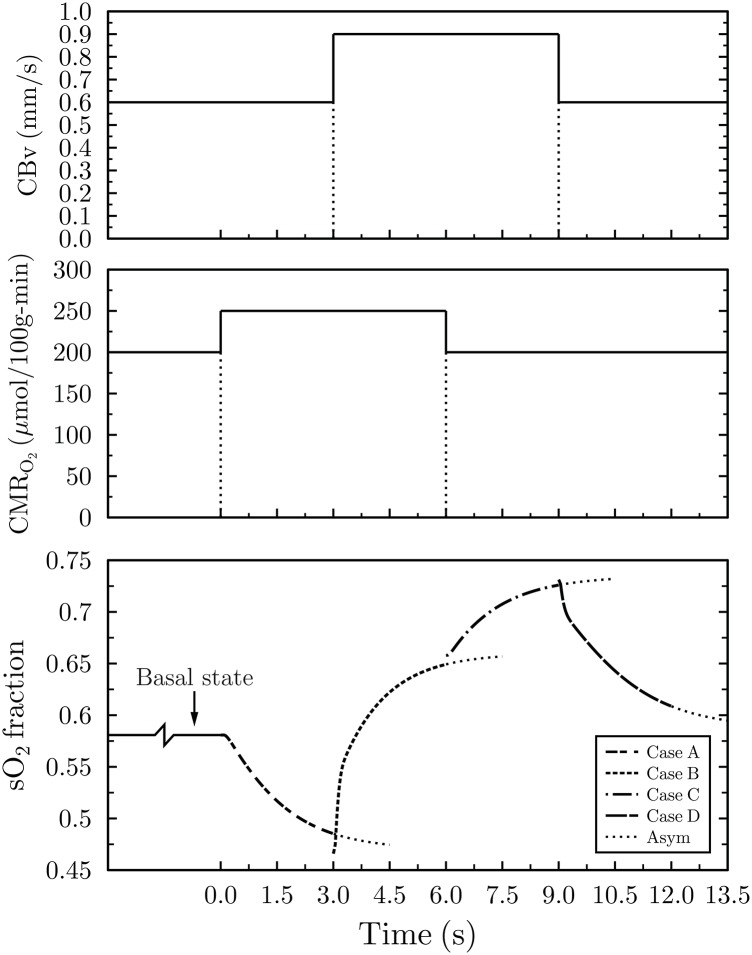
Fig 4. Hemoglobin saturation response at the capillary outlet for m = (ΔCBv/CBv)/(ΔCMRO2/CMRO2) = 2.
The lower plot depicts hemoglobin saturation following neural activation, mimicked by the four discrete physiological cases, namely, A to D. Once stimulation occurs, CMRO2 increases, from its resting (basal) state, from 200 to 250 μmol/100g/min (case A) causing a drop in sO2. Subsequently, CBv increases from 0.6 to 0.9 mm/s resulting in a steep increase in saturation (case B). Next, CMRO2 reverts back to its basal level of 200 μmol/100g/min leading to a further increase in sO2 (case C). Finally, CBv transitions to its resting state (case D) with the concomitant asymptotic drop in sO2 to its basal value. The top and middle plots illustrate the duration of the activated and basal oxygen metabolic and blood velocity transitions, respectively. “Asym” stands for asymptotic values.

