
Figure 2.
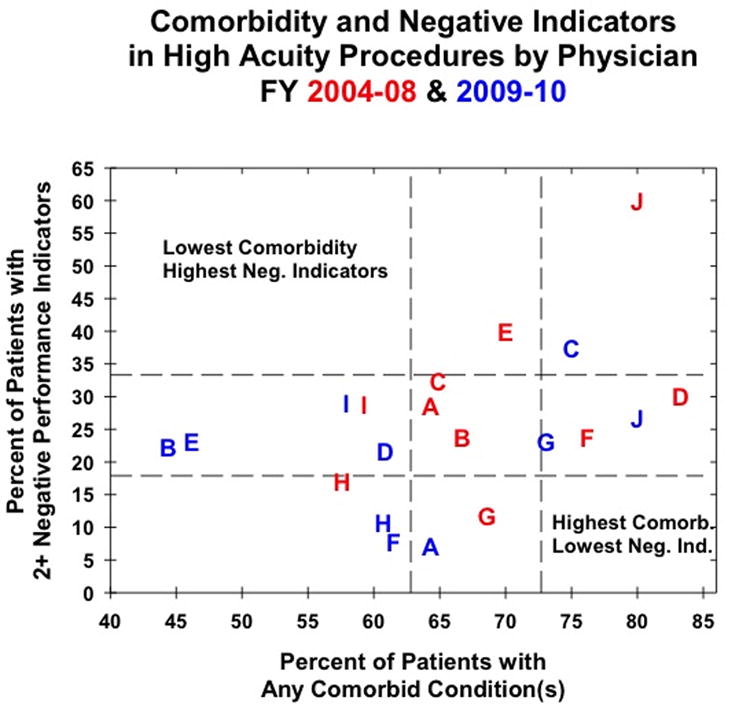
Physician performance for high acuity procedures as measured by patient comorbidity and the presence of negative indicators for the initial (red) and post-feedback (blue) cohorts. Letters represent individual physicians to track changes in performance.