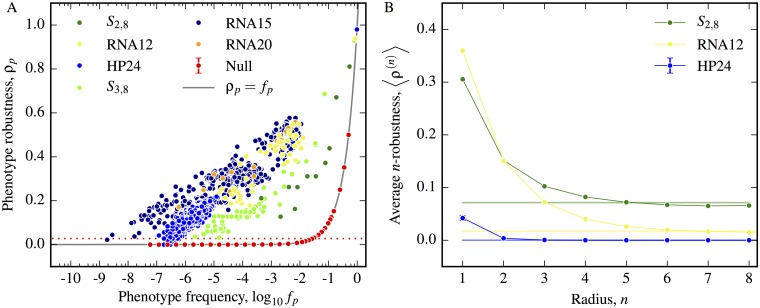
Fig 2. Greater mutational robustness indicates the presence of neutral correlations.
A) The phenotype robustness ρp is plotted as a function of frequency fp for all phenotypes in the RNA secondary structure models: RNA12, RNA 15, RNA20, the Polyomino models for protein quaternary structure: S2,8 S3,8 and the HP protein folding model HP24. Each model has an associated random model with the same frequencies, but we only show one example, with K = 4 and L = 12 and a set of phenotypes chosen with a broad range of frequencies to best illustrate the relationship (red points). All random models closely follow the expected theoretical curve ρp = fp (grey line). The biophysical models exhibit a much larger robustness than the random models, which indicates the presence of positive neutral correlations. The red dotted line is δ (Eq (5)) for K = 4, L = 12. If (ρ > δ) then large neutral networks are expected, which is much more likely for the biophysical models than for the random model. B) The average n-robustness 〈ρ(n)〉, defined in Eq 3, for each of the three biological GP maps, along with the expected values 〈ρ(n)〉 = 1/NP for the associated random null models (flat coloured horizontal lines) is plotted against n. Across all three GP maps, we see a typical decay in robustness towards the random null model expectation with increasing mutational distance. From this decay a neutral correlation length can be defined which is shorter for the HP model than for the other two models. Error bars for HP24 are the standard error on the mean of the average n-robustness.

