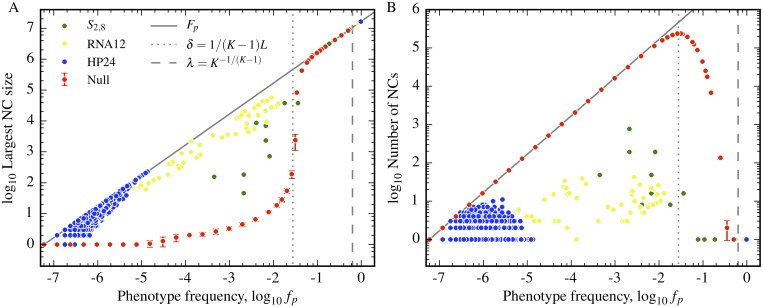
Fig 3. Biological GP maps have much larger and fewer neutral components than their random counterparts due to neutral correlations.
A) The logarithm of the largest neutral component for a given phenotype is plotted as a function of frequency for random null models (with K = 4, L = 12) and three biological GP maps, RNA12, S2,8 and HP24. The vertical dotted line denotes the giant component threshold δ ≈ 1/36, defined in Eq (5), for the schematic random model with K = 4, L = 12. The vertical dashed line denotes the single component threshold λ ≈ 0.37, defined in Eq (6), for the schematic random model. The biological GP maps show much larger connected components below these thresholds, due to the presence of positive neutral correlations. B) The logarithm of the total number of neutral components against frequency is plotted for the same models. The theoretical thresholds δ and λ work well for random model but again the number of components in the biophysical models differ greatly from the random model expectation due to the presence of correlations. In both plots, error bars represent a single standard deviation from the 100 independent realisations of the random null model used to derive the neutral component statistics.

