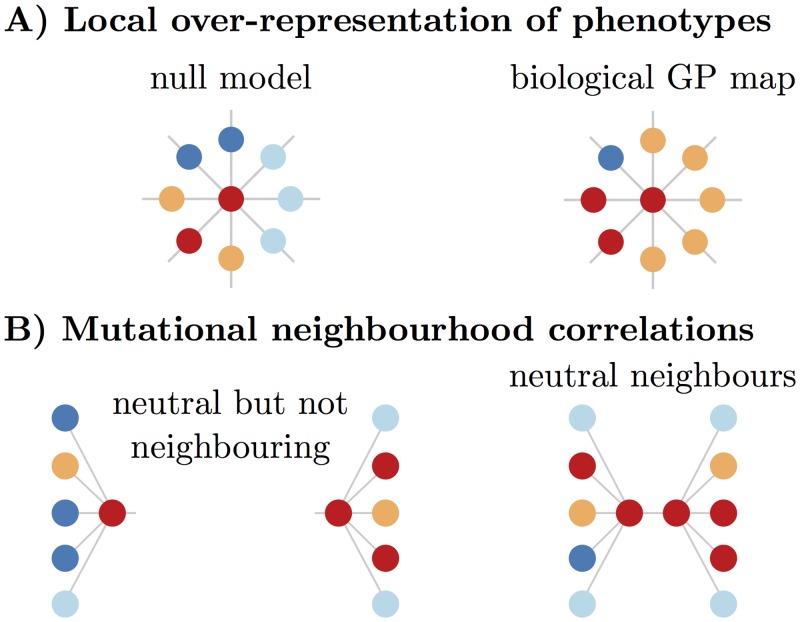
Fig 5. Illustration of further non-neutral correlations.
A) On the right, the orange phenotype is over-represented relative to the null model: The red genotype in the centre has more orange neighbours than would be expected by the global frequency of orange. B) The phenotypes that appear in the mutational neighbourhood of two neutral neighbours are expected to be more similar (right) than two non-neighbouring genotypes of the same phenotype (left).

