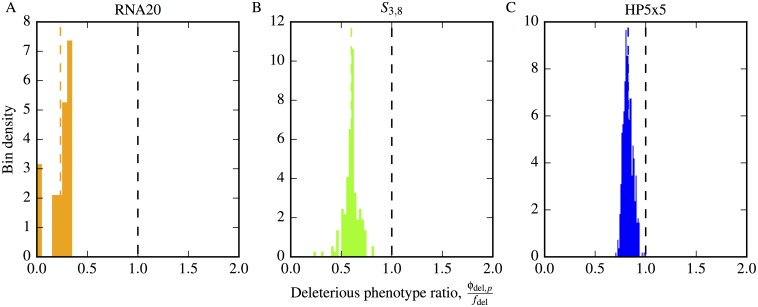
Fig 8. Non-neutral deleterious phenotype correlations: The deleterious phenotype is under-represented in the neighbourhood of folding or self-assembling phenotypes.
We present results for the three GP maps: A) RNA20, B) S3,8 and C) HP5x5. Histograms of the ratio of the phenotype mutation probability (ϕdel,p) divided by the null model expectation of the global frequency (fdel) for the deleterious phenotype (non-folding for RNA/HP, non-assembling for Polyominoes). The distribution is clearly skewed to values < 1, as highlighted by the dashed vertical coloured lines representing the mean in each case.

