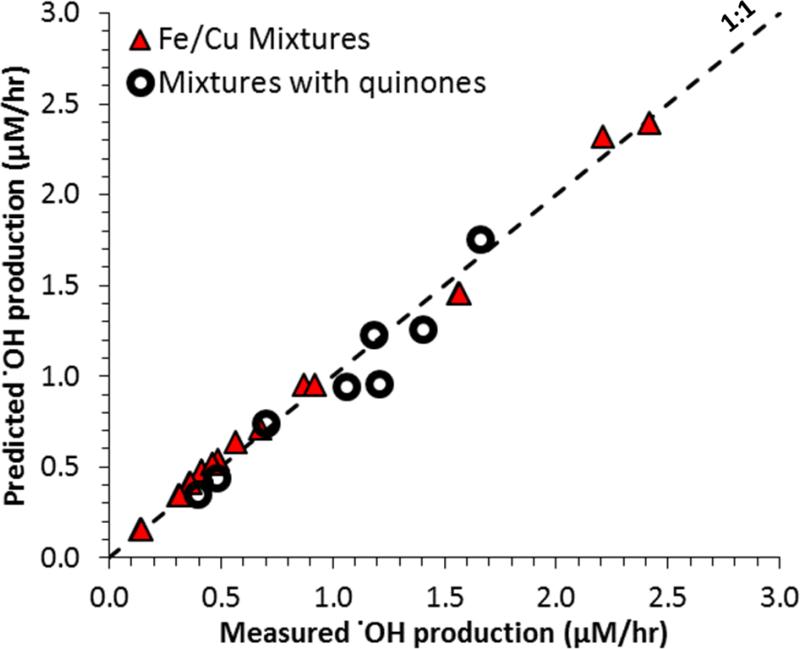
Figure 4.
Measured versus predicted rates of .OH production from mixtures of Fe, Cu and/or quinones. The predicted .OH is calculated using equation 6 in Table 1. This equation works for mixtures of Fe and Cu (triangles) and mixtures of Fe and/or Cu and quinones (circles). The composition of all solutions is included in the supplemental Table S1.

